Including some surprising stats about smart speaker use.
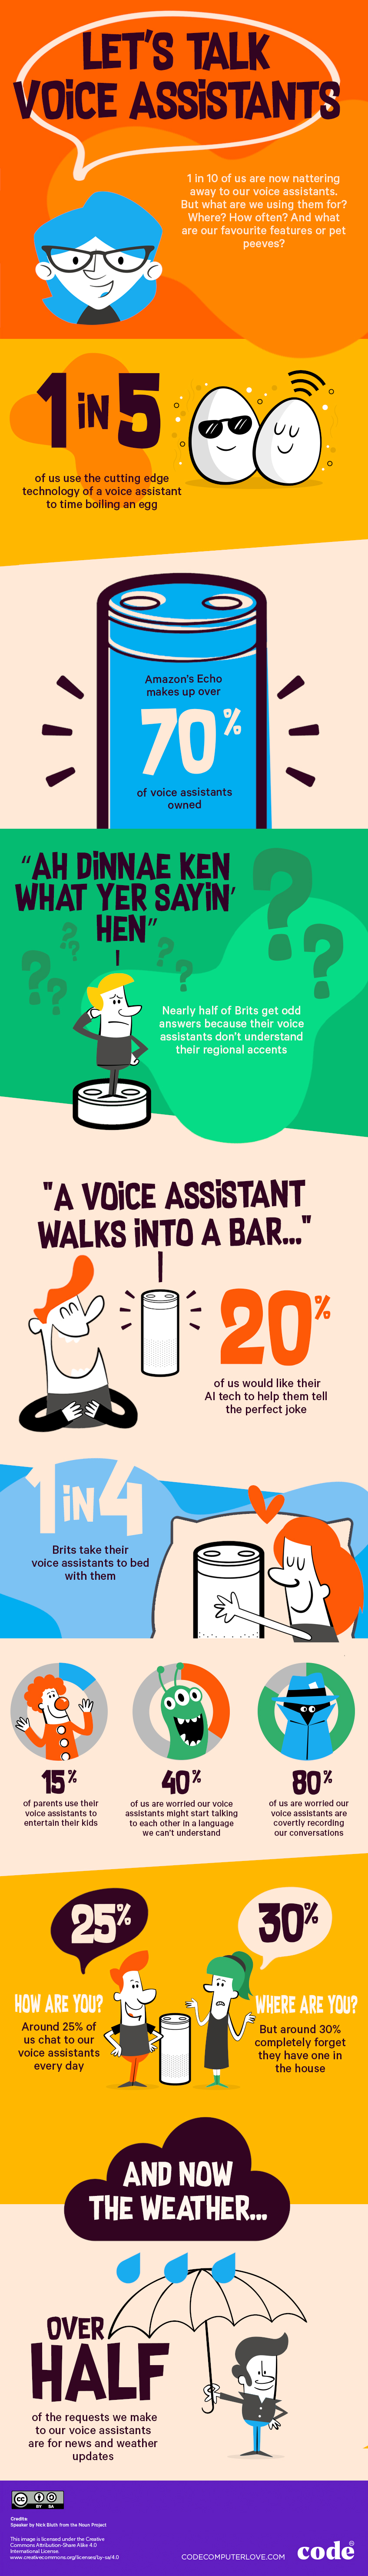
Voice interfaces are one of the hottest user experience trends in recent years. New figures reveal that one in 10 Brits now owns at least one of these devices.But how are we really using them? Code Computerlove polled over 1,000 smart speaker owners, and turned their findings into this top infographic. And if this inspires you to put together your own data visualisation, take a look at our list of the best infographic tools around.
Read on for some surprising facts about how UK residents are using this amazing new smart speaker technology.
That's right, a fifth of us are using our clever invisible friends to make sure we don't overcook our eggs in the morning. It's a task that can be accomplished using a normal clock, but, hey, where's the fun in that?
In fact, mundane tasks lead the way when it comes to smart help – 65 per cent of owners used their assistant to play music or the radio, and over half use it to check the weather forecast.
Furthermore, Alexa still rules the roost in the voice assistant space, with Amazon Echos making up 70 per cent of the devices owned. There are other good options available though (take a look at our sister site TechRadar's guide to smart speakers for more info).
The big question with any new technology is: is it just a fad? Perhaps not, judging by the fact that 25 per cent of owners chat to their smart assistants every day, even taking it to bed with them. However, a further 30 per cent have forgotten they even have a voice assistant in the house. Less encouraging.
For more interesting finds – including our deep-seated fears about voice assistants – take a look at the full infographic below. Click on the infographic to see the full-size version.
Get the Creative Bloq Newsletter
Daily design news, reviews, how-tos and more, as picked by the editors.
Ruth spent a couple of years as Deputy Editor of Creative Bloq, and has also either worked on or written for almost all of the site's former and current print titles, from Computer Arts to ImagineFX. She now spends her days reviewing mattresses and hiking boots as the Outdoors and Wellness editor at T3.com, but continues to write about design on a freelance basis in her spare time.