20 essential new devtool techniques
Get the most out of browser developer tools with these new techniques.

Sign up to Creative Bloq's daily newsletter, which brings you the latest news and inspiration from the worlds of art, design and technology.
You are now subscribed
Your newsletter sign-up was successful
Want to add more newsletters?
With five browsers regularly releasing bigger and better versions of their embedded developer tools, the outlook for web developers has never been rosier. These tools are indispensable for building, debugging, analysing and optimising our sites and web apps.
In recent years, the Chrome and Firefox DevTools have innovated at a breakneck pace to provide a superior debugging environment. Microsoft’s Edge has also made great steps forward, and Opera’s tools are now in complete parity with Chrome.
Below are 20 tips to help you get even more from your DevTools.
Article continues below01. Expand all nodes
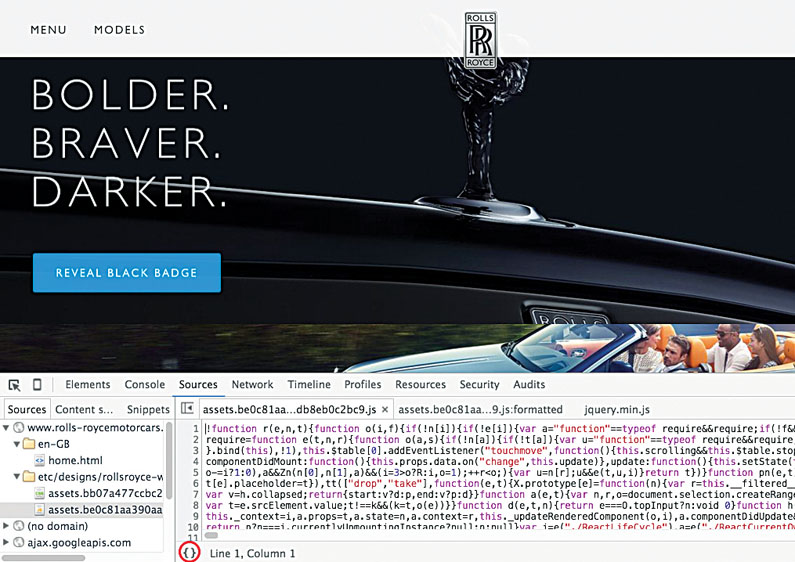
The Elements panel shows the Document Object Model (DOM) tree of the current page and is the first panel that appears when we hit F12 on Windows or Cmd+Alt+I on Mac. In Firefox this panel is called the Inspector, while in IE/Edge it is called the DOM Explorer.
When you right-click on the page and inspect an element, the DOM tree is automatically expanded to reveal that element within the pane. We can also drill down the DOM tree using the triangular arrow to the left of each element. In Chrome, Firefox, Opera and Safari, holding down Alt whilst clicking that triangle to open a closed element will expand every node underneath, providing you with fast and full visibility of all the element’s children.
02. Move Elements
You can drag and drop elements within the DOM tree to change their position in the document. Simply click and drag the element into the position you want it, and a line will appear showing where it will be placed.
03. Increment CSS Values
Styles applied to the elements in the DOM are displayed in the Styles panel shown to the right of the DOM tree. In Firefox, this panel is called Rules. From it, you can modify the values for any CSS property currently applied to your elements, as well as adding new properties and values.
Sign up to Creative Bloq's daily newsletter, which brings you the latest news and inspiration from the worlds of art, design and technology.
We can adjust numerical property values such as margins, padding, borders, width, height, rotations and even colour, using the cursor keys. The Up or Down keys will increment or decrement the value by a unit of 1. Holding the Shift key while pressing Up or Down will change the unit to 10, while holding the Alt key will change the unit to 0.1. In Chrome and Opera, you can also use the mouse wheel to adjust the value.
04. View the Box Model
The CSS Box Model describes the space taken by each element, including margin, padding, border, width and height. These values are used by the rendering engine to calculate the rectangular space taken up by the element, and ultimately the layout of our page.
As modern web developers we often simplify our layout calculations by configuring the Box Model so the border and padding are included in the width and height values. We use the following CSS:
body * { box-sizing: border-box; }With an element selected in our DOM tree, we can view the CSS Box Model of this element within the Styles/Rules panel. In Chrome and Opera, this is found under the Computed tab. In Firefox it is in the Box Model tab; in Safari the tab is called Metrics, and in IE/Edge it is called Layout.
Hovering over the Box Model diagram with your mouse in Chrome, Firefox or Opera will apply a coloured shade to the relevant element and properties on the page, so you can visualise your layout. You can edit the values of the Box Model just by clicking and changing them.
05. Style pseudo-classes
We can force the display of CSS pseudo-classes like :hover and :focus from within DevTools. This enables us to style and debug these element states without having to interact with them.
At the top of the Styles/Rules panel is an icon that will enable the other states. Depending on the browser, the icon is either a pin icon, three small boxes, or the letters ‘:hov’ or ‘a:’.
In Safari, right-clicking on an element in the DOM tree view of the Elements panel will show a menu bar where ‘Force pseudo-classes’ is an option.
In Chrome, Firefox and Opera, whenever we turn on a pseudo-state, an orange indicator will appear next to the element. The :before and :after pseudo-styles for an element can be found below the main list of styles in Chrome and Opera.
06. Influence CSS
In Chrome and Opera, long-hovering over a particular CSS selector in the Styles panel will highlight where it is being used on the page. With an element selected, we can turn on and off individual CSS classes to see what they are styling. Simply toggle the ‘.cls’ option in the Styles panel, then check and uncheck each class name.
07. Pick colours
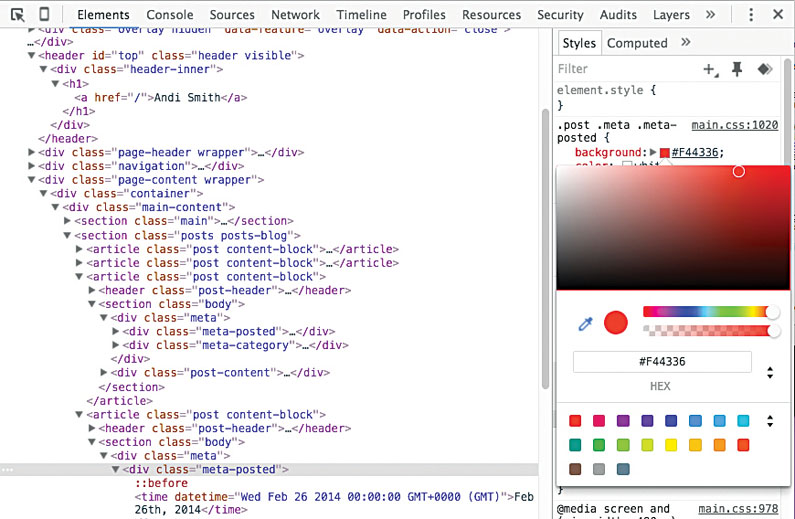
Chrome, Opera, Firefox and Edge all offer a colour picker to enable you to choose and define the colours for your page. To access the colour picker, click the swatch next to any colour property within the Styles panel.
In Chrome and Opera, you can toggle the colour value between hex, RGBa and HSLa using the arrow icon alongside the value. You can also see a palette showing the colours that are already being used on your page in Chrome, Opera and Edge, as well as creating a custom palette and a palette containing the Material Design colours.
08. Dock the DevTools
Each of the developer tools can be repositioned to one of three options: dock to the bottom, dock to the right, or a separate window. The docking option can be found in the top-right corner of the DevTools (or top left in Safari). The keyboard shortcut Cmd+Shift+D will toggle the last two chosen options in Chrome, Firefox and Opera. In Edge, Ctrl+P will toggle between docking to the bottom and a separate window.
09. Inspect Media Queries
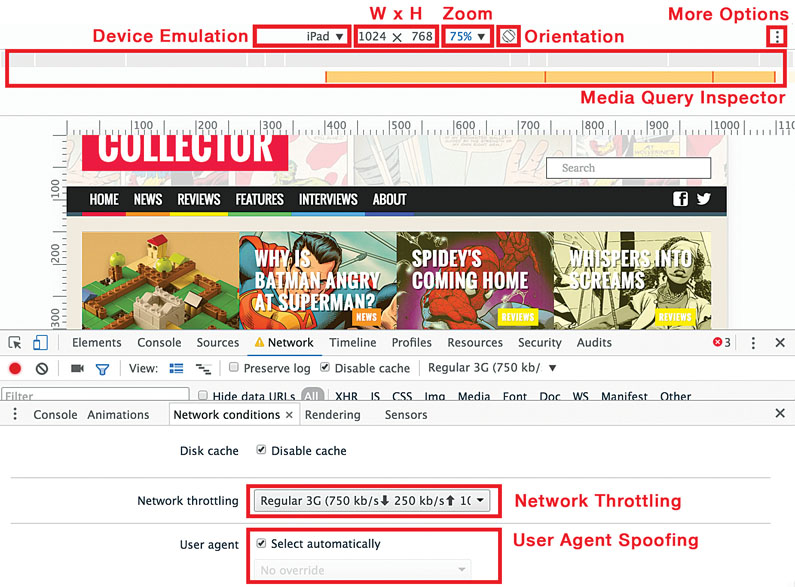
We can see how our web page will appear on different screen sizes using Responsive Design Mode. In Chrome and Opera, this is toggled by pressing the devices icon to the left of the top bar; while in Firefox the icon is a resizing square.
Firefox offers a series of differing width and height combinations to try, with the ability to type into the drop-down field to add additional sizes. IE and Edge offer similar options to change display size within the Emulation panel.
As well as a list of devices and the ability to customise your own, Chrome and Opera offer an additional Media Query Inspector (found under More Options > Show Media Queries) that enables you to quickly view and change between each of your breakpoints. These browsers also offer the ability to throttle network speed and adjust round trip time (RTT) to simulate slower networks.
10. Enable Experiments
There are a number of extra features in the DevTools that aren’t quite ready for mainstream release, but can provide some extra debugging functionality, as long as you’re willing to accept they may not be stable.
Enable them by typing ‘chrome://flags’ into the address bar in Chrome (or ‘opera://flags’ in Opera) and then hitting ‘Enable’ on the option for ‘Enable developer tools experiments’. New functionality can then be toggled on and off from within the Settings menu under the Experiments tab.
Current experiments include an Accessibility and Promise inspector, and a layout editor for changing margins and paddings (accessible from the Style panel). You can find even more experimental features in the Chrome DevTools by pressing the Shift key six times when on the Experiments tab. These include experiments to display a contrast line in the colour picker; CPU throttling and showing a GPU data graph on the Timeline panel.
Firefox also lets users turn on experimental features individually from its settings menu.
11. Debug Animation
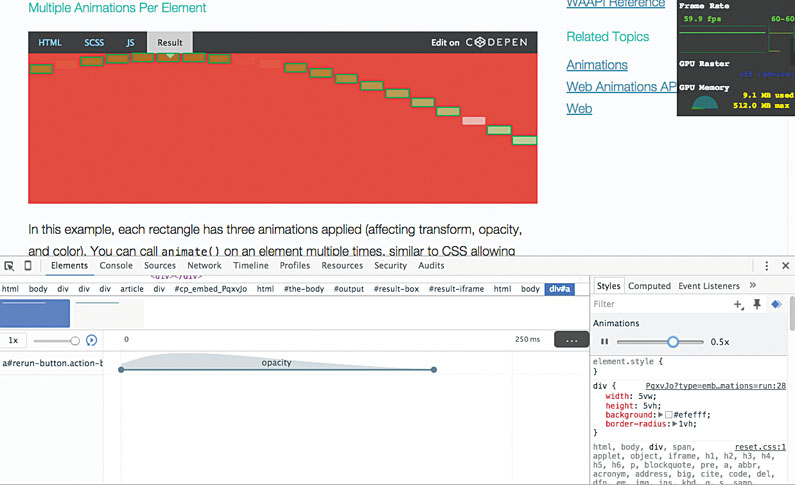
Debugging CSS animations can be difficult at times, but Chrome, Firefox and Opera have turned their attention to making this process easier. Each has provided new features to enable you to analyse how your animations are playing and working together.
To play and replay animations at different speeds in Chrome and Opera, use the Animations panel accessible from the Console tray (press Esc to toggle open), or the Animations panel in Firefox.
The controls allow for the debugging of CSS transitions, CSS animations and the Web Animations API. From the Animations panel in Chrome/Opera there is also live editing of animation timings and delays, with a drag-and-drop interface for further debugging.
12. Debug Animation Easing
Alongside each CSS transition and animation style that contains an easing property, you can find a swatch. Clicking this will open up an easing debugging menu with predefined easing options, together with a graph tool allowing for greater customisation and live previews.
13. Monitor Events
The Console panel is great for logging debugging information about your web page and entering JavaScript to interact with the document. In Chrome, Opera and Safari it can also be used to monitor and log events.
To monitor a particular event use:
monitorEvents(elem, 'eventType');Where elem is the element you wish to monitor and eventType is the event (for example, mouse, click, keydown, touch, resize or scroll). If the element you wish to monitor is currently selected in the Elements panel, you can use $0 to access it.
To stop monitoring events use the command:
unmonitorEvents(elem);14. Re-Run Console Commands
After running a command in the Console panel, simply press the Up arrow to reveal a history of previous console commands. To re-run one, hit Enter.
15. Change Frame Focus
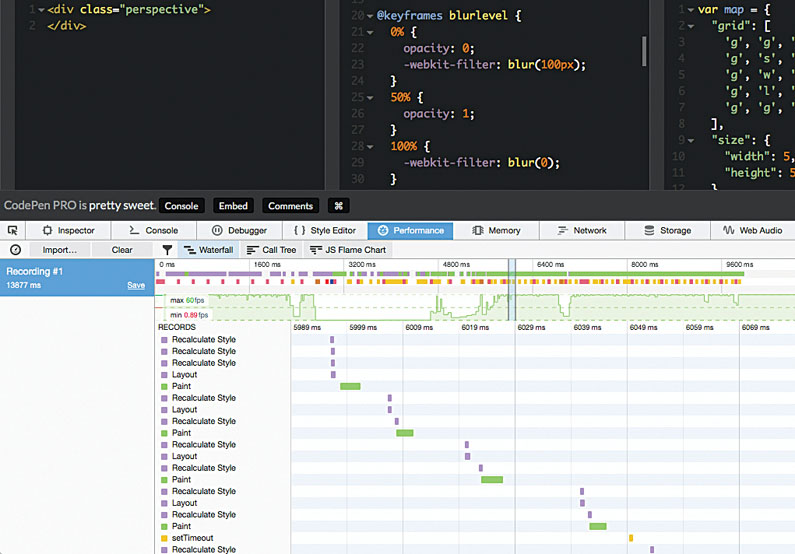
If your web page contains one or multiple iframes (as is often the case with tools like CodePen, JS Bin and JSFiddle), debugging the right frame from within the console can prove a challenge. You can target the frame from the DevTools console by selecting the frame from a drop-down list found at the top of Chrome and Opera’s console window; or with the frame selection icon in the top-right of Firefox’s menu bar. Safari offers the same option to the right of the console command line.
16. Emulate Geolocation
Geolocation can be emulated in Edge from the Emulation menu. In Chrome and Opera, geolocation and the accelerometer can be emulated by selecting More Tools>Sensors from the menu on the right-hand side. Geolocation allows you to override your position with another set of longitude and latitude coordinates, or emulate an unavailable position.
17. Emulate Orientation
Accelerometer emulation can be found in the same panel as geolocation in Chrome and Opera. This allows you to change the alpha, beta and gamma values of the device orientation:
Alpha represents the motion of the device around the Z-axis from 0 to 360 degrees
Beta represents the motion of the device around the X-axis from -180 to 180 degrees, resembling a front-to-back motion
Gamma represents the motion of the device around the Y-axis from -90 to 90 degrees, resembling a left-to-right motion
Changing the values will trigger a deviceorientation event, which you can test with: monitorEvents(window, 'deviceorientation'); .
18. Run a Performance Audit
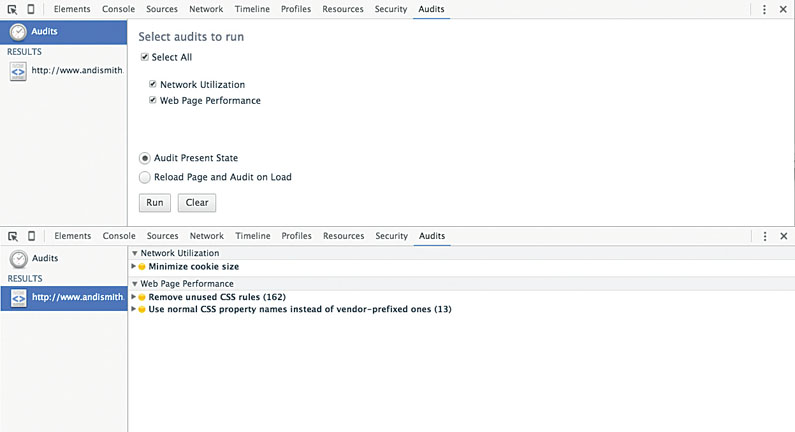
You don’t need to be an expert in how network traffic and pages render to find useful tips for how to speed up your site. Chrome and Opera both provide the ability to audit, and offer advice on how to improve the network and page performance.
To run an audit, select the Audits panel, choose the tests you want to execute and hit Run. The network audit will identify bottlenecks in your site load (such as large image sizes); while the performance audit will identify ways to speed up your page (such as removing unused CSS rules).
19. Filter Resources
The Network panel in each browser shows a list of resources that have been requested during page load, together with the status code, the file size and the amount of time it took for the request to return. The accompanying waterfall graph visualises the time spent loading each of these resources onto the page.
While the resource list can be filtered by type (such as CSS, images or XHR) in each browser, Chrome and Opera also allow for advanced filtering in their search boxes, with the following prefixes:
domain: To filter resources from the specified domain
larger-than: For file size
mixed-content: For filtering resources loaded through HTTP on a secure site
status-code: To filter on a particular status code (such as ‘404 not found’).
A number of extra columns are also available in Chrome and Opera’s Network panels that can provide further useful information. These include Cache-Control and Initiator. You can toggle columns on and off by right-clicking any of the headers.
20. Debug Asynchronously
The Sources/Debugger panel allows you to add breakpoints and walk through your code, watching variables and examining the call stack as you go. By watching a variable you can monitor its value as your program is executed.
To add a watch, just type the name of the variable into the panel on its right-hand side. The watch will keep its value up to date as you step through your code.
With Chrome and Opera you can also view the full call stack of asynchronous JavaScript callbacks and promises by checking the Async box in the right-hand corner. When you walk through the call stack, the watch values will also update to their state at the time. You can make debugging the call stack easier by naming callbacks rather than making them anonymous functions.
Summing up
Browser developer tools can be invaluable when developing and debugging web projects. It really is worth investing the time to experiment and explore the DevTools in your browser of choice so you get to know how it all works. And with new features appearing all the time to address classic problems (such as a layout editor) and help debug brand new web functionality (like the Sources Service Worker panel), it has never been more important to stay up to date.
