CSS jargon explained: the specificity graph
CSS architecture expert Harry Roberts explains how you can plot your project's specificity.
Sign up to Creative Bloq's daily newsletter, which brings you the latest news and inspiration from the worlds of art, design and technology.
You are now subscribed
Your newsletter sign-up was successful
Want to add more newsletters?

Five times a week
CreativeBloq
Sign up to Creative Bloq's daily newsletter, which brings you the latest news and inspiration from the worlds of art, design and technology.

Once a week
By Design
Sign up to Creative Bloq's daily newsletter, which brings you the latest news and inspiration from the worlds of art, design and technology.

Once a week
State of the Art
Sign up to Creative Bloq's daily newsletter, which brings you the latest news and inspiration from the worlds of art, design and technology.

Seasonal (around events)
Brand Impact Awards
Sign up to Creative Bloq's daily newsletter, which brings you the latest news and inspiration from the worlds of art, design and technology.
One of ITCSS's fundamental principles is the Specificity
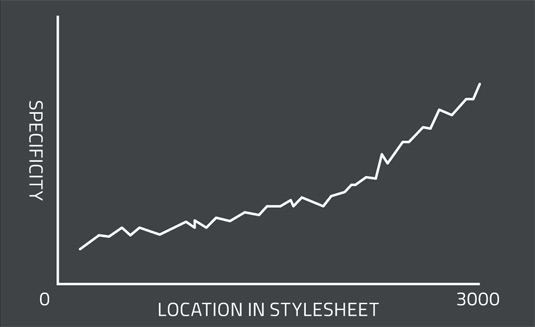
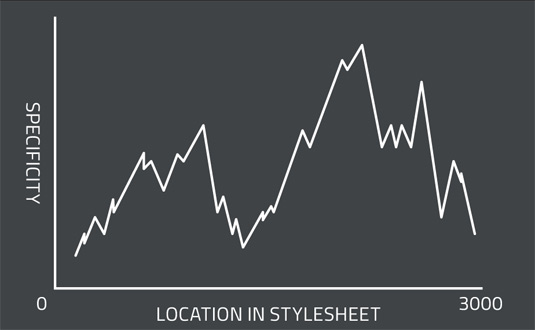
Graph. This is another model that visualises your CSS project's specificity on a simple line graph. Its shape will tell you how well your project meets the low-to-high specificity metric.
The Specificity Graph represents your entire project – all your CSS, once compiled and on the user's machine. Along the X-axis we plot the location of a selector in the CSS (e.g. line 1229), and on the Y-axis we plot the specificity of that selector (e.g. one class).
What we want to see is a graph that trends upwards – a CSS project whose specificity is gradually increasing as we get further into it.
We do not want a very spiky graph, as this shows us we have a lot of higher specificity selectors defined before lower specificity ones – this is how we get into the Specificity Wars.
Whilst it is possible to accurately plot this information, the graph's value is in being a mental model. You can determine the rough shape of your project's Specificity Graph at a glance.


Words: Harry Roberts
Harry Roberts is a consultant frontend architect and CSS architecture expert. Find him on twitter @csswizardry or visit his site csswizardry.com. This article was originally published in net magazine issue 267.
Sign up to Creative Bloq's daily newsletter, which brings you the latest news and inspiration from the worlds of art, design and technology.
Liked this? Read these!

The Creative Bloq team is made up of a group of art and design enthusiasts, and has changed and evolved since Creative Bloq began back in 2012. The current website team consists of eight full-time members of staff: Editor Georgia Coggan, Deputy Editor Rosie Hilder, Ecommerce Editor Beren Neale, Senior News Editor Daniel Piper, Editor, Digital Art and 3D Ian Dean, Tech Reviews Editor Erlingur Einarsson, Ecommerce Writer Beth Nicholls and Staff Writer Natalie Fear, as well as a roster of freelancers from around the world. The ImagineFX magazine team also pitch in, ensuring that content from leading digital art publication ImagineFX is represented on Creative Bloq.
