Pro tips for creating interactive infographics
The future of data visualisation lies in interactivity. Here's how to create a truly stunning interactive infographic.
Daily design news, reviews, how-tos and more, as picked by the editors.
You are now subscribed
Your newsletter sign-up was successful
Want to add more newsletters?

Five times a week
CreativeBloq
Your daily dose of creative inspiration: unmissable art, design and tech news, reviews, expert commentary and buying advice.

Once a week
By Design
The design newsletter from Creative Bloq, bringing you the latest news and inspiration from the worlds of graphic design, branding, typography and more.

Once a week
State of the Art
Our digital art newsletter is your go-to source for the latest news, trends, and inspiration from the worlds of art, illustration, 3D modelling, game design, animation, and beyond.

Seasonal (around events)
Brand Impact Awards
Make an impression. Sign up to learn more about this prestigious award scheme, which celebrates the best of branding.
The rise in interactive infographics has correlated with a similar upsurge in animation and transition tools and guides, both of which make the process of creating the most complex effects surprisingly manageable.
Now you've seen what you're aiming for, let's take a look at some of the tools and resources that will help you build your own interactive infographic.
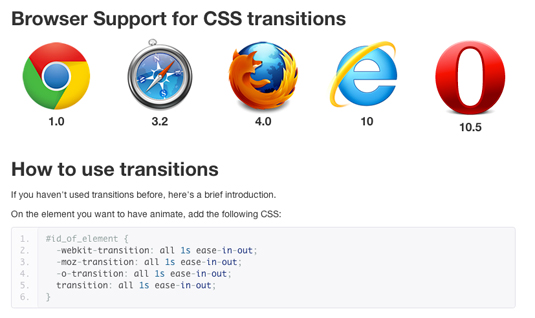
01. CSS3 = Awesome

This site is helpful for anyone looking to get an overview on CSS animations, transforms, transitions and filters. It offers detailed tutorials on all these topics, and is a great place to start for a thorough technical overview.
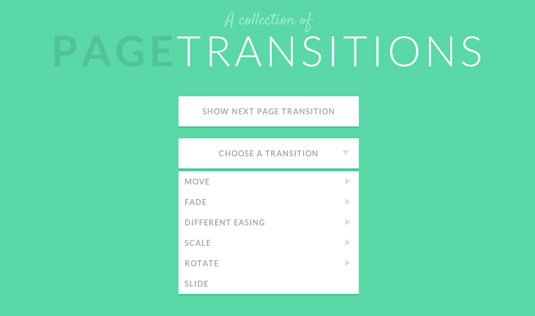
02. A collection of page transitions

This site demonstrates various popular transitions that can be achieved between pages, which can be very useful for inspiration as well as information.
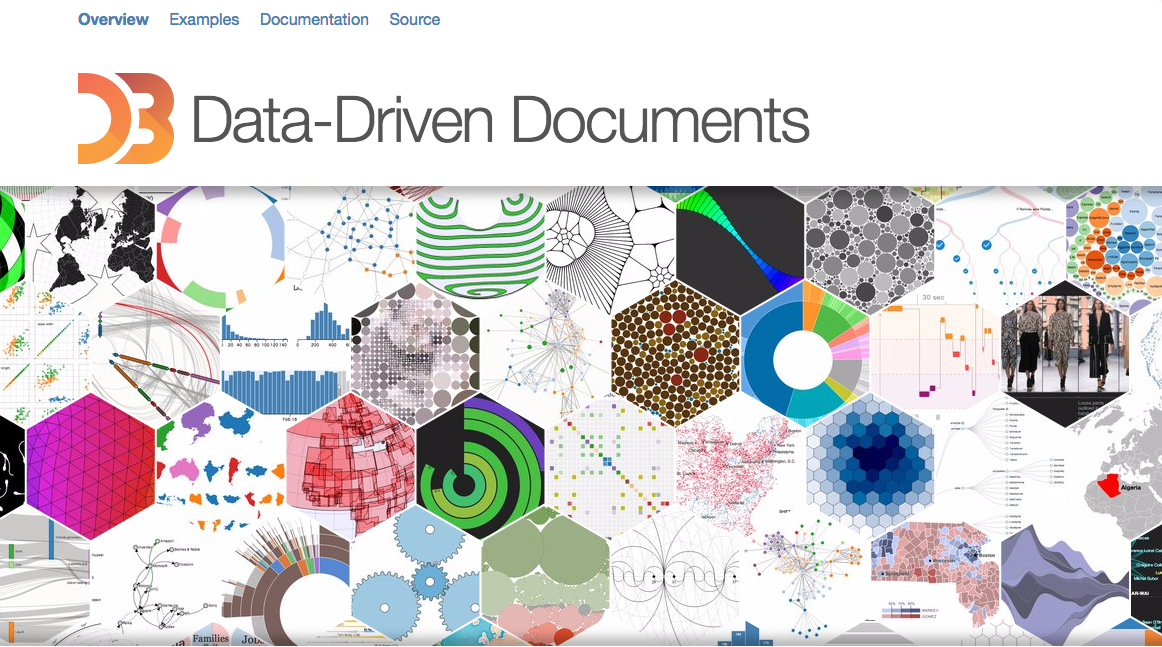
03. D3.js

D3.js is a JavaScript library that enables you to transform and animate data in any number of ways, using HTML, CSS, and SVG. With it you can create the collapsing graphs or spinning data points that are one of the key features of most interactive infographics. With all these resources freely available, the reasons for making a traditional static infographic are becoming less and less viable.
Read more:
- The beginner's guide to brochure infographics
- The best infographics on the web today
- Free tools for creating infographics
Daily design news, reviews, how-tos and more, as picked by the editors.
- 1
- 2
Current page: Helpful resources for making infographics
Prev Page Impressive interactive infographics to inspire you
The Creative Bloq team is made up of a group of art and design enthusiasts, and has changed and evolved since Creative Bloq began back in 2012. The current website team consists of eight full-time members of staff: Editor Georgia Coggan, Deputy Editor Rosie Hilder, Ecommerce Editor Beren Neale, Senior News Editor Daniel Piper, Editor, Digital Art and 3D Ian Dean, Tech Reviews Editor Erlingur Einarsson, Ecommerce Writer Beth Nicholls and Staff Writer Natalie Fear, as well as a roster of freelancers from around the world. The ImagineFX magazine team also pitch in, ensuring that content from leading digital art publication ImagineFX is represented on Creative Bloq.
