63 of the best infographics

Best Infographics - An Infographic explaining what makes a good infographic.
(Image credit: Rock Content)

The best infographics turn heavy data, facts or timelines into clear, easily digestible visual design that can be a delight to look at. They discipline combines several skills, with good design, illustration and animation often combining with an eye for salient data. The results is a presentation of often complex information in a way that's more stimulating and engaging than any factsheet.

If you are looking to create your own infographic, then check out our visualisation tools or our roundup of the best infographic makers to help get you started. You may also want to consider signing up to Adobe Creative Cloud (or Photoshop alternatives if you'd prefer.) But before you head off and start on your own, scroll through our pick of the best infographics we've seen for data visualisation inspiration.

We have divided our list into categories. You can head straight to what you're looking for or jump from section to section as you please. If you'd like to have a proper good look at any of the infographics, simply click on it for a large view. We start our roundup with a section on infographics about...infographics (infograph-ception, or what?)

The best infographics about infographics

01. What is an Infographic?

Click the image to see the full version (Image credit: Beth Kanter)

This simple but totally genius infographic made from lego was designed by Hot Butter Studio's Beth Kanter. Kanter is a visual marketeer who used this very graphic in her blog that explains how enforcing visual order upon data can help an audience draw conclusions and how to use them constructively. 

02. Why your Brain Craves Infographics

Best infographics: why your brain craves them

Click the image to see the full version

Why do the best infographics become so popular? This interactive infographic by NeoMam Studios explores exactly what it is about them that hits the spot. featuring some cool parallax scrolling effects along the way.

03. The Infographic of Infographics

Click the image to see the full version

This infographic from artist Ivan Cash unpicks the trend for data visualisation and explores the stats surrounding the best infographics. It explains what fonts are popular, how many sections are typically included, what themes tend to crop up, and more.  

The best explore a world infographics

Click the image to enlarge it (Image credit: Ken Bromley Art Supplies)

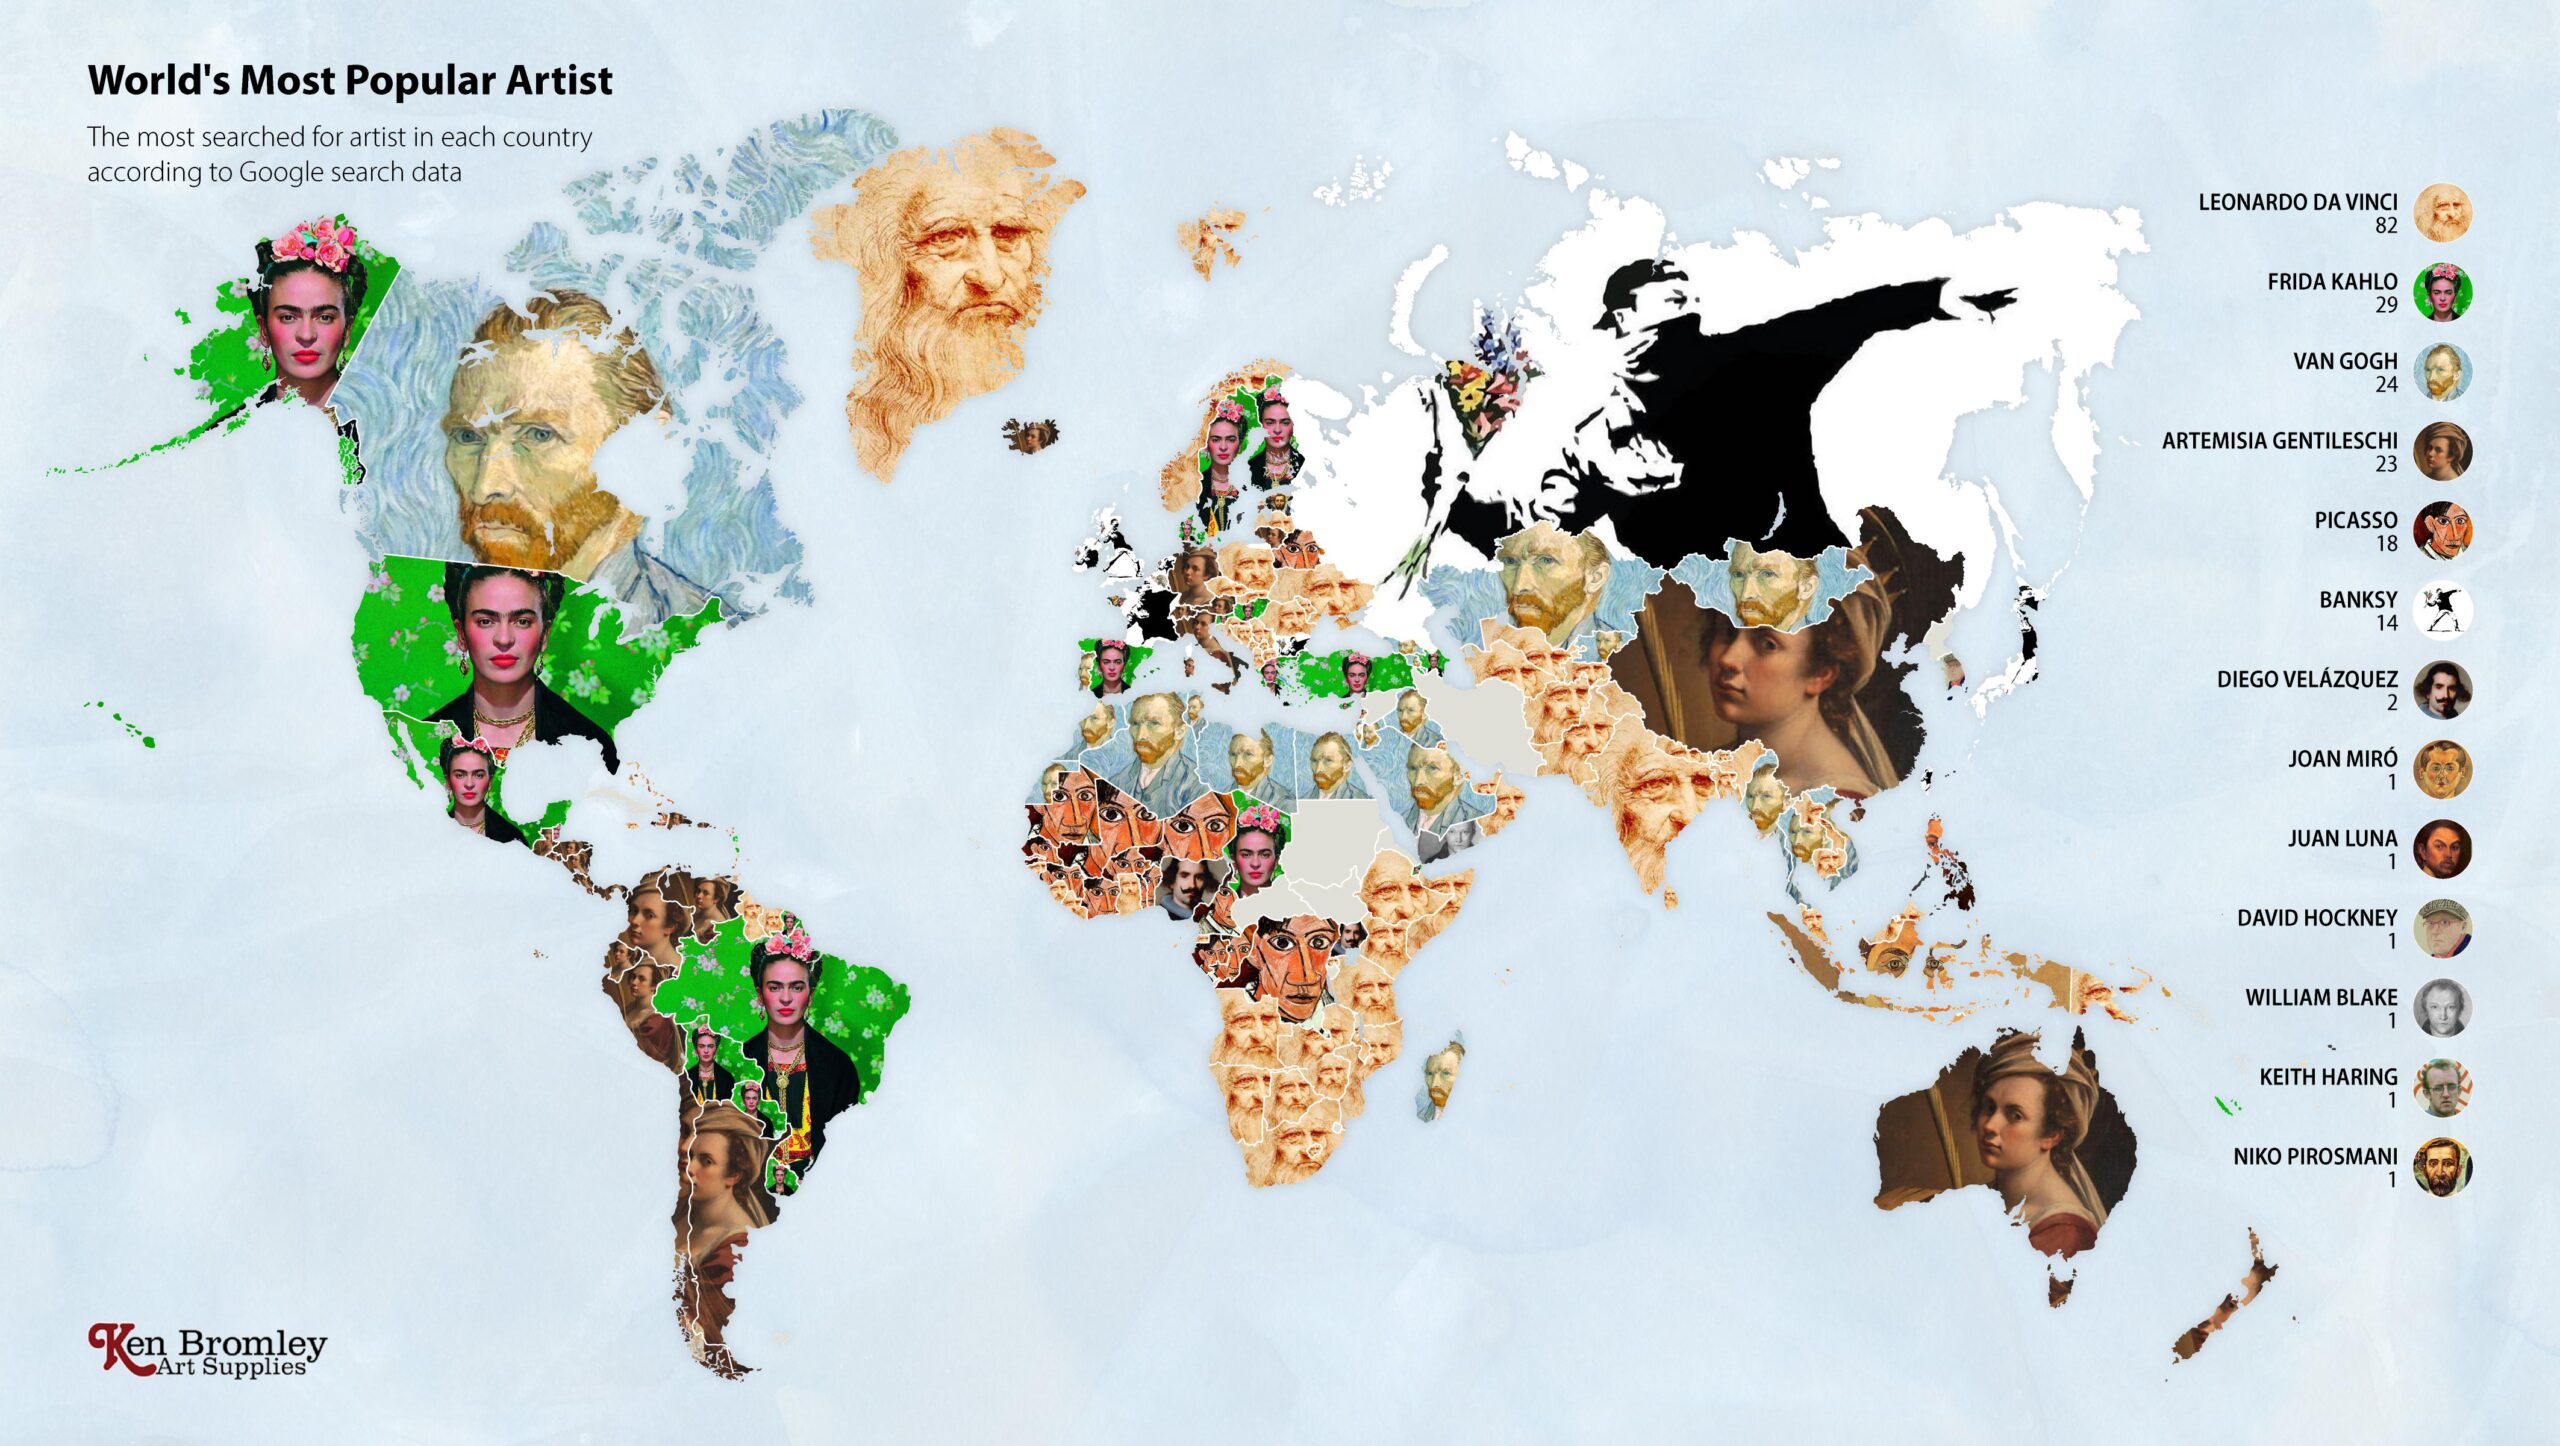
Who is your favourite artist? Frida Kahlo, Van Gogh, Banksy... the possibilities span countries and eras. But have you ever wondered if your passions lie with the same artist as other art fans in your country? This set of art-based data visualisations, created by Ken Bromley Art Supplies, are some of the most beautiful we've seen. 

05. Font Psychology and Pop Culture

Click the image to see the full version (Image credit: Vennage)

What effect does your font choice have on your audience, psychologically? That’s what this design, produced by Venngage, sets out to explore by reference to some of the most popular Netflix shows of recent years. From The Crown to 13 Reasons Why, what does each show’s typography say about their viewers, and what moods, genres and trends do they highlight? 

06. History of Life
The best infographics: History of Life

Click the image to see the full version

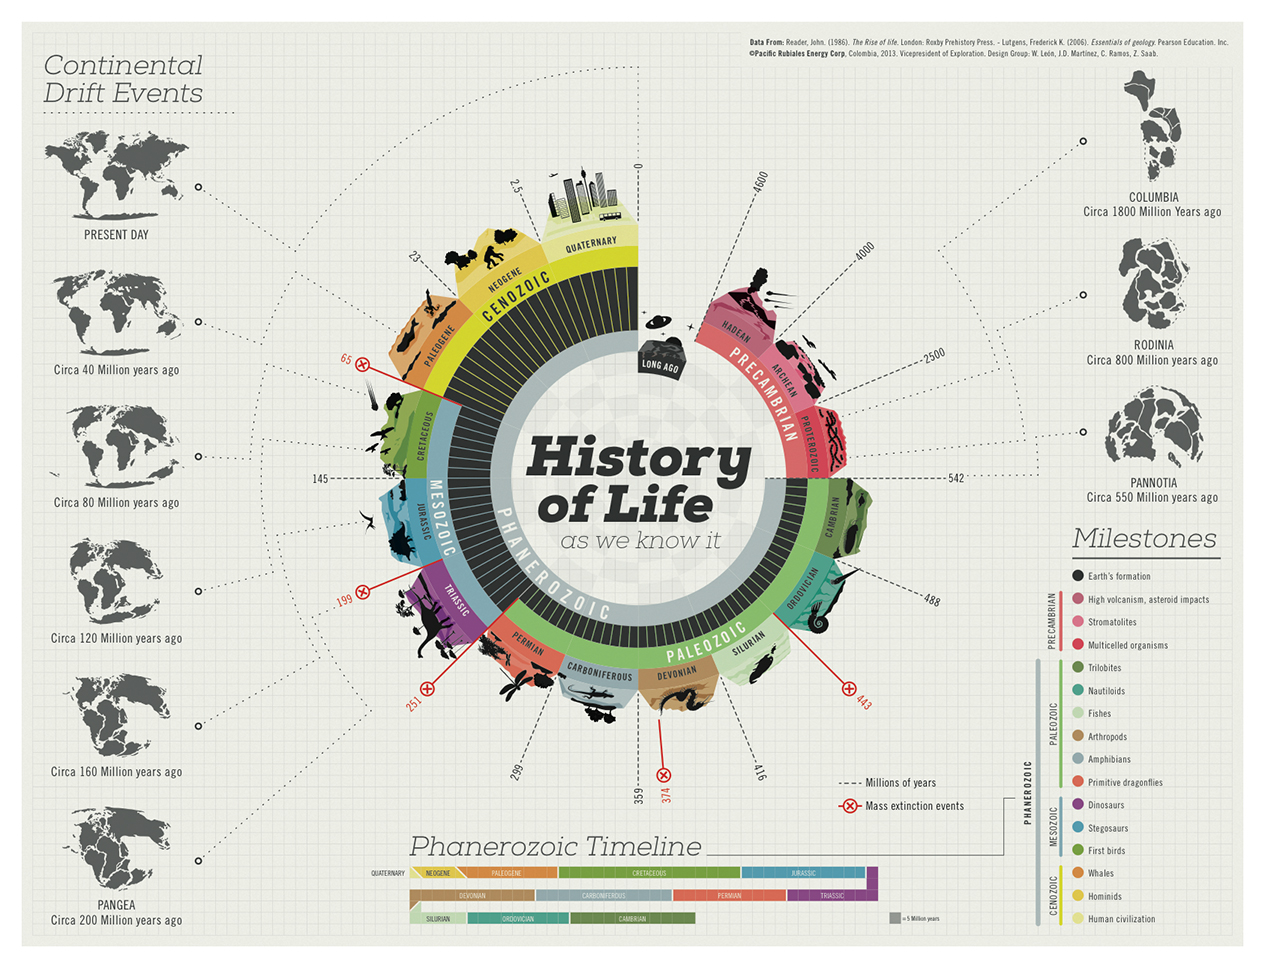
What better way to explore a world than by exploring our own world, and this is one of the best infographics to do so. Created by Juan Martinez, it defines each geological era of planet Earth, the changing shape of the land continents, and includes timelines, life milestones and mass extinction events. 

07. A Stranger to Words

Dyslexic Artist Meng Chih Chiang created this data visualisation graph, which explores her own world of language. The fascinatingly complex infographic expresses the curve of her personal learning experience as she encounters language in her day-to-day life.

08. 50 years of Doctor Who

Click the image to see the full version (Image credit: Sam Gibley)

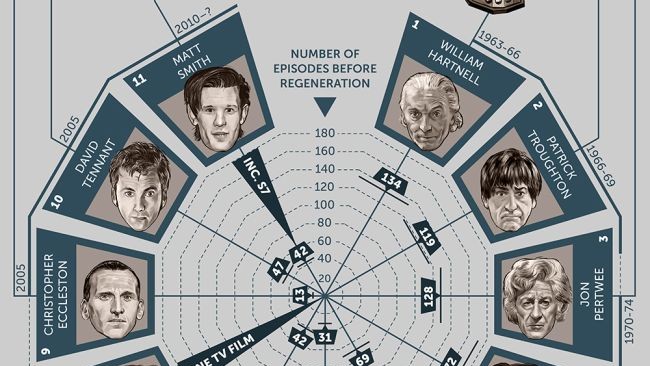
Illustrator Sam Gilbey has produced some of the best pop-culture infographics over the years. And we particularly loved this design, commissioned by Virgin to mark the 50th anniversary of Doctor Who back in 2013. 

There have been a number of new Doctors since, of course, including ones sneakily retro-engineered by the writers into the show's existing canon. But for anyone new to Who, it gives a good overview of the first five decades of the show; and for die-hard fans, it's a lovely look back at an era when Doctor Who continuity was relatively straightforward.

09. Hip Hop infographic

Click the image to see the full version

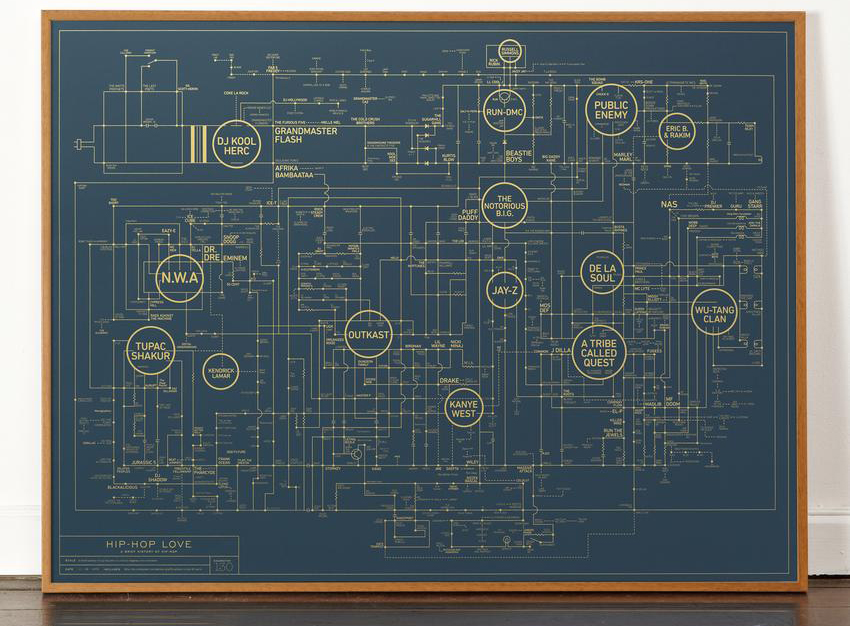
Design studio Dorothy has carved some of the best infographics in poster form. Its designs often chart the many complex connections between entertainment genres and sub-genres, and are perfect for any superfan to display on their studio walls.

Stand-out examples include the 'blueprints' series, exploring the history of hip hop, showcased here; alternative and electronic music over the decades; the 'colour wheel' series, dedicated to the colour palettes of movies, books and music; and 'star charts', which map the relationships between seminal films, actors and directors.

10. Oddity Viz

Click the image to see the full version

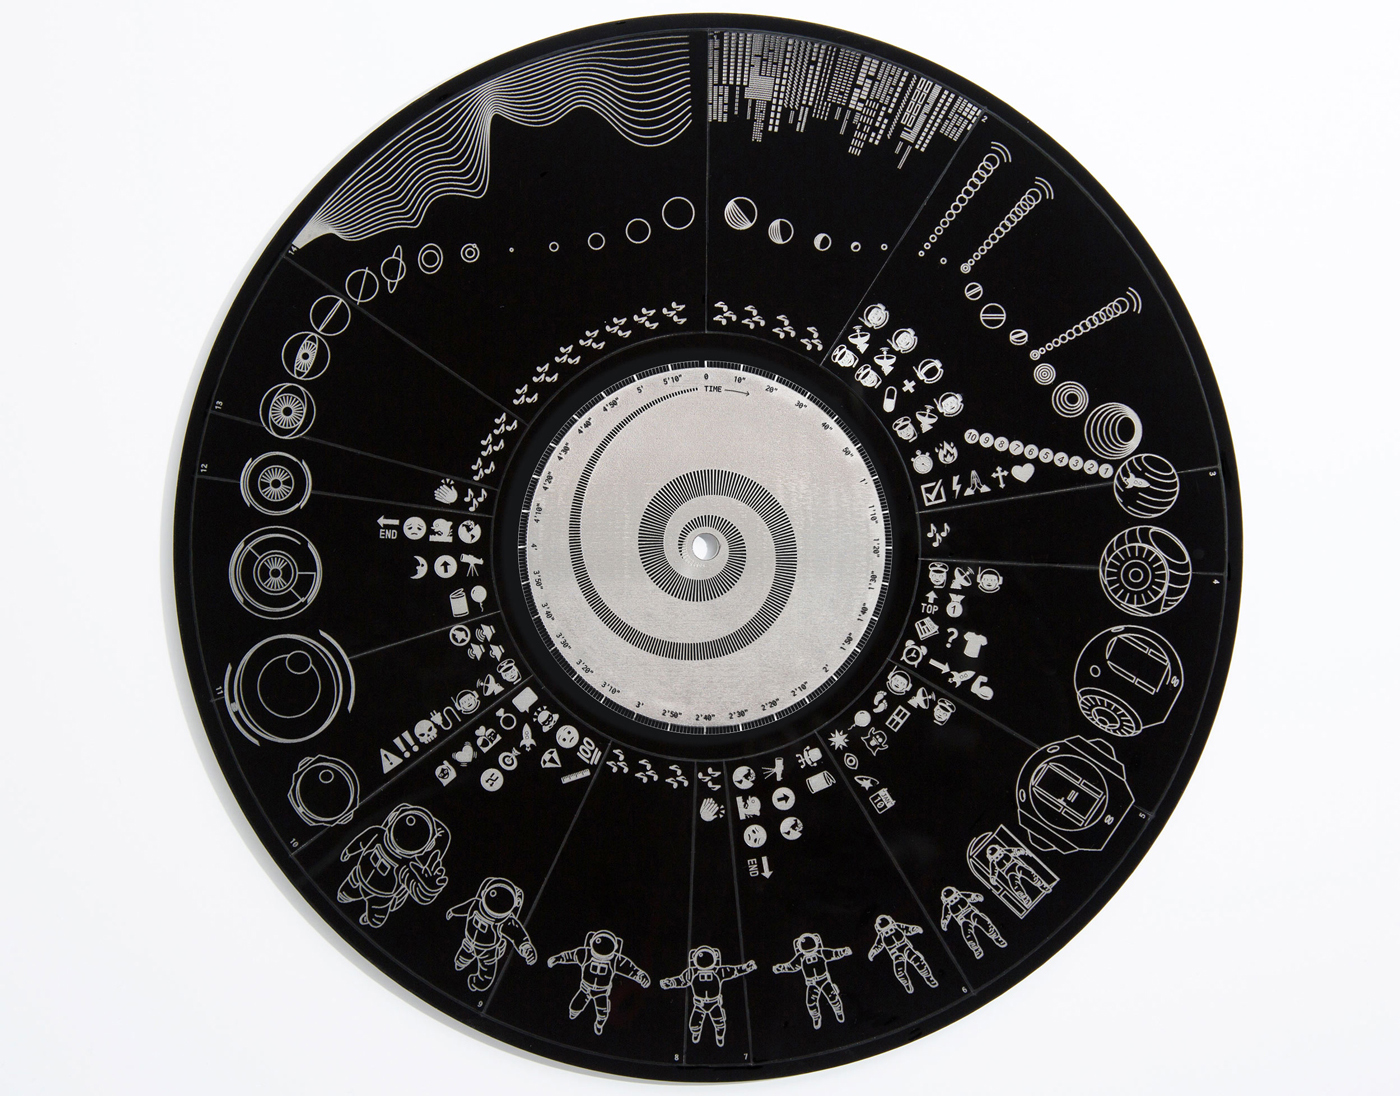
The winner of an Information is Beautiful award, Valentina D'Efilippo's creative visualisation of the iconic Bowie track Space Oddity contrasts Dorothy's expansive genre-spanning creations by opting to go narrow and deep instead.

D'Efilippo worked with researcher Miriam Quick to gather data about the track, which she then visualised as a series of ten 12-inch discs, each of which deconstructs the track in a different way: according to melodies, harmonies, lyrics, structure, story and more.

11. An Analysis of The Beatles infographic

Click the image to see the full version

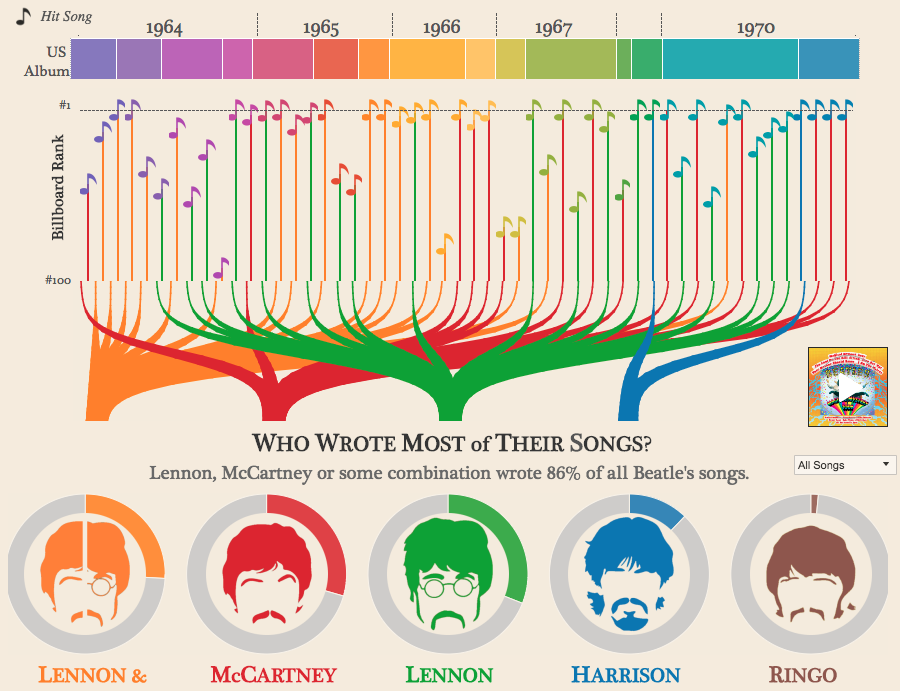
This interactive creation is one of the best infographics we've seen to analyse the Fab Four. It breaks down their career by year and by album and providing plenty of insight into who wrote what, which Beatle had the biggest vocabulary (hint: it wasn't Ringo), what most of their songs were about, and much more.

12. SWANH.NET

The best infographics: Star Wars: A New Hope

Click the image to see the full version

The best infographics go the extra mile, but this one goes the extra light year! Swiss illustrator Martin Panchaud has adapted the original 1977 Star Wars film, A New Hope, into a 123-metre-long animated wonder. Created in Illustrator CC, using 157 pictures across 22 separate files, it took him over a year to produce.

13. Grand Taxonomy of Rap Names

Click the image to see the full version

This colourful infographic examines 282 famous rappers in startling detail. Our favourite section? 'Audacious spelling': with sub-categories of 'Improper use of K' (hey, OutKast) and 'Misspelled adjectives' (that's you, Ludacris). This infographic was brought to you by Pop Chart Lab; a company set up by a book editor and a graphic designer who joined forces with one modest goal in mind: to render all of human experience in chart form.

14. The Magnificent Multitude of Beer

The best infographics: beer

Click the image to see the full version

The multitude of varieties, brands and tastes of beer available can sometimes be a little overwhelming. So what better way to showcase the taxonomy of beer than with an infographic? Another one from Pop Chart Lab, this infographic ended up being so big (at 60x40in) that the team had to enlist the help of another printing firm to handle the job. After all that work, let's hope they found time to head to the bar.

15. MeTooMomentum

dandelions explaining MeToo movement

Click the image to see the full version

This infographic from Valentina D'Efilippo focuses on the first six months of the #MeToo movement, analysing around 200,000 tweets from that time. You can read more about the project in our post.

16. Avengers, Assemble!

The best infographics: Avengers Assemble

Click the image to see the full version

This infographic from Lemonly breaks down facts about the superheroes that feature in the classic Marvel's Avengers Assemble. You can find out about each character's strength, skills, brains, gadgets and heart via some cool pie charts. The results are then compiled to show the team's greatest collective strengths. 

17. Inception

The best infographics: Inception

Click the image to see the full version

The best infographics keep things simple. And given how complex Christopher Nolan's 2010 blockbuster movie Inception was, a little bit of simplicity goes a long way here. This brilliant illustration was created by New York-based graphic designer Rick Slusher. It summarises the film by depicting each character as a coloured line, and the layers of dreams as concentric circles.

The best infographics for lists

18. What NOT to Get a Graphic Designer for Christmas

Click the image to see the full version (Image credit: Future)

It’s never too early start thinking about Christmas presents, and this tongue-in-cheek infographic focuses on exactly what to AVOID buying the designer in your life. Illustrated by Simon Middleweek, this fun list brilliantly illustrates the pitfalls involved in shopping for a creative professional, from cliched hipster garb to cringeworthy T-shirts.

19. 30 Life Skills Every Functioning Adult Should Master

Click the image to see the full version (Image credit: Business Insider)

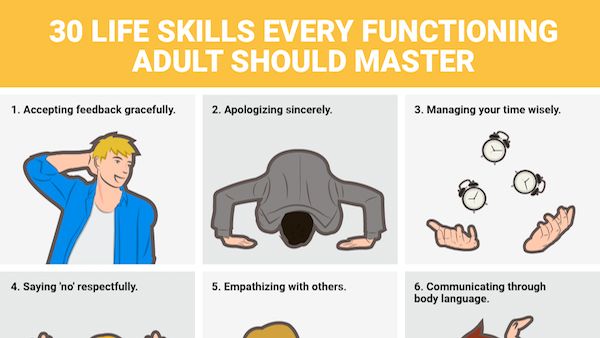
Do you consider yourself ‘grown up’ yet? If the answer’s yes, then maybe this infographic from Business Insider will make you think again. It runs through 30 of the most important traits every adult should have under their belt, from being able to mend your own clothes to speaking a second language. If like us, you haven’t mastered all of these yet, don’t let it stress you out, but use it as a handy motivational tool to improve your life.

20. The ABC of Design infographic

The best infographics: ABC of design

Click the image to see the full version

The design industry is shaped by a glossary of terms that every professional needs to know. This ABC infographic from DesignMantic runs through 26 essential words and phrases and explains their meaning through stylish graphics.

21. 10 Commandments of UI Design

Click the image to see the full version

One of the best infographics we've seen covering UI design. Created by Designmantic, it's broken down into colour-coded themes (create a story, ensure accessibility and so on), with simple icons to convey the key rules within each category. 

22. A-Z of Typography Terms

Click the image to see the full version

Do you know your aperture from your apex? How about the difference between a finial and a flag? If not, then this typography terms infographic acts as a handy cheatsheet that will help you get up to speed. After more information? Take a look at our roundup of the best typography tutorials.

23. 40 Little Things to Break your Creative Block

Click the image to see the full version

Creative droughts are the stuff of nightmares for artists, designers, photographers, and just about anyone with an imagination. But how do you reignite your creative spark? Designed by the team at Creative Market, this is one of the best infographics to inspire you at your time of need. And if these tips don't work, have a look at our list of ways to overcome a creative rut.

24. 15 Golden Principles of Visual Hierarchy

Click the image to see the full version

This infographic by Designmantic explains the key rules you need to know to create all-important visual hierarchy in your data, from using the golden ratio to implementing grid theory to bring balance to your work.

25. The 10 Commandments of Typography

Click the image to see the full version

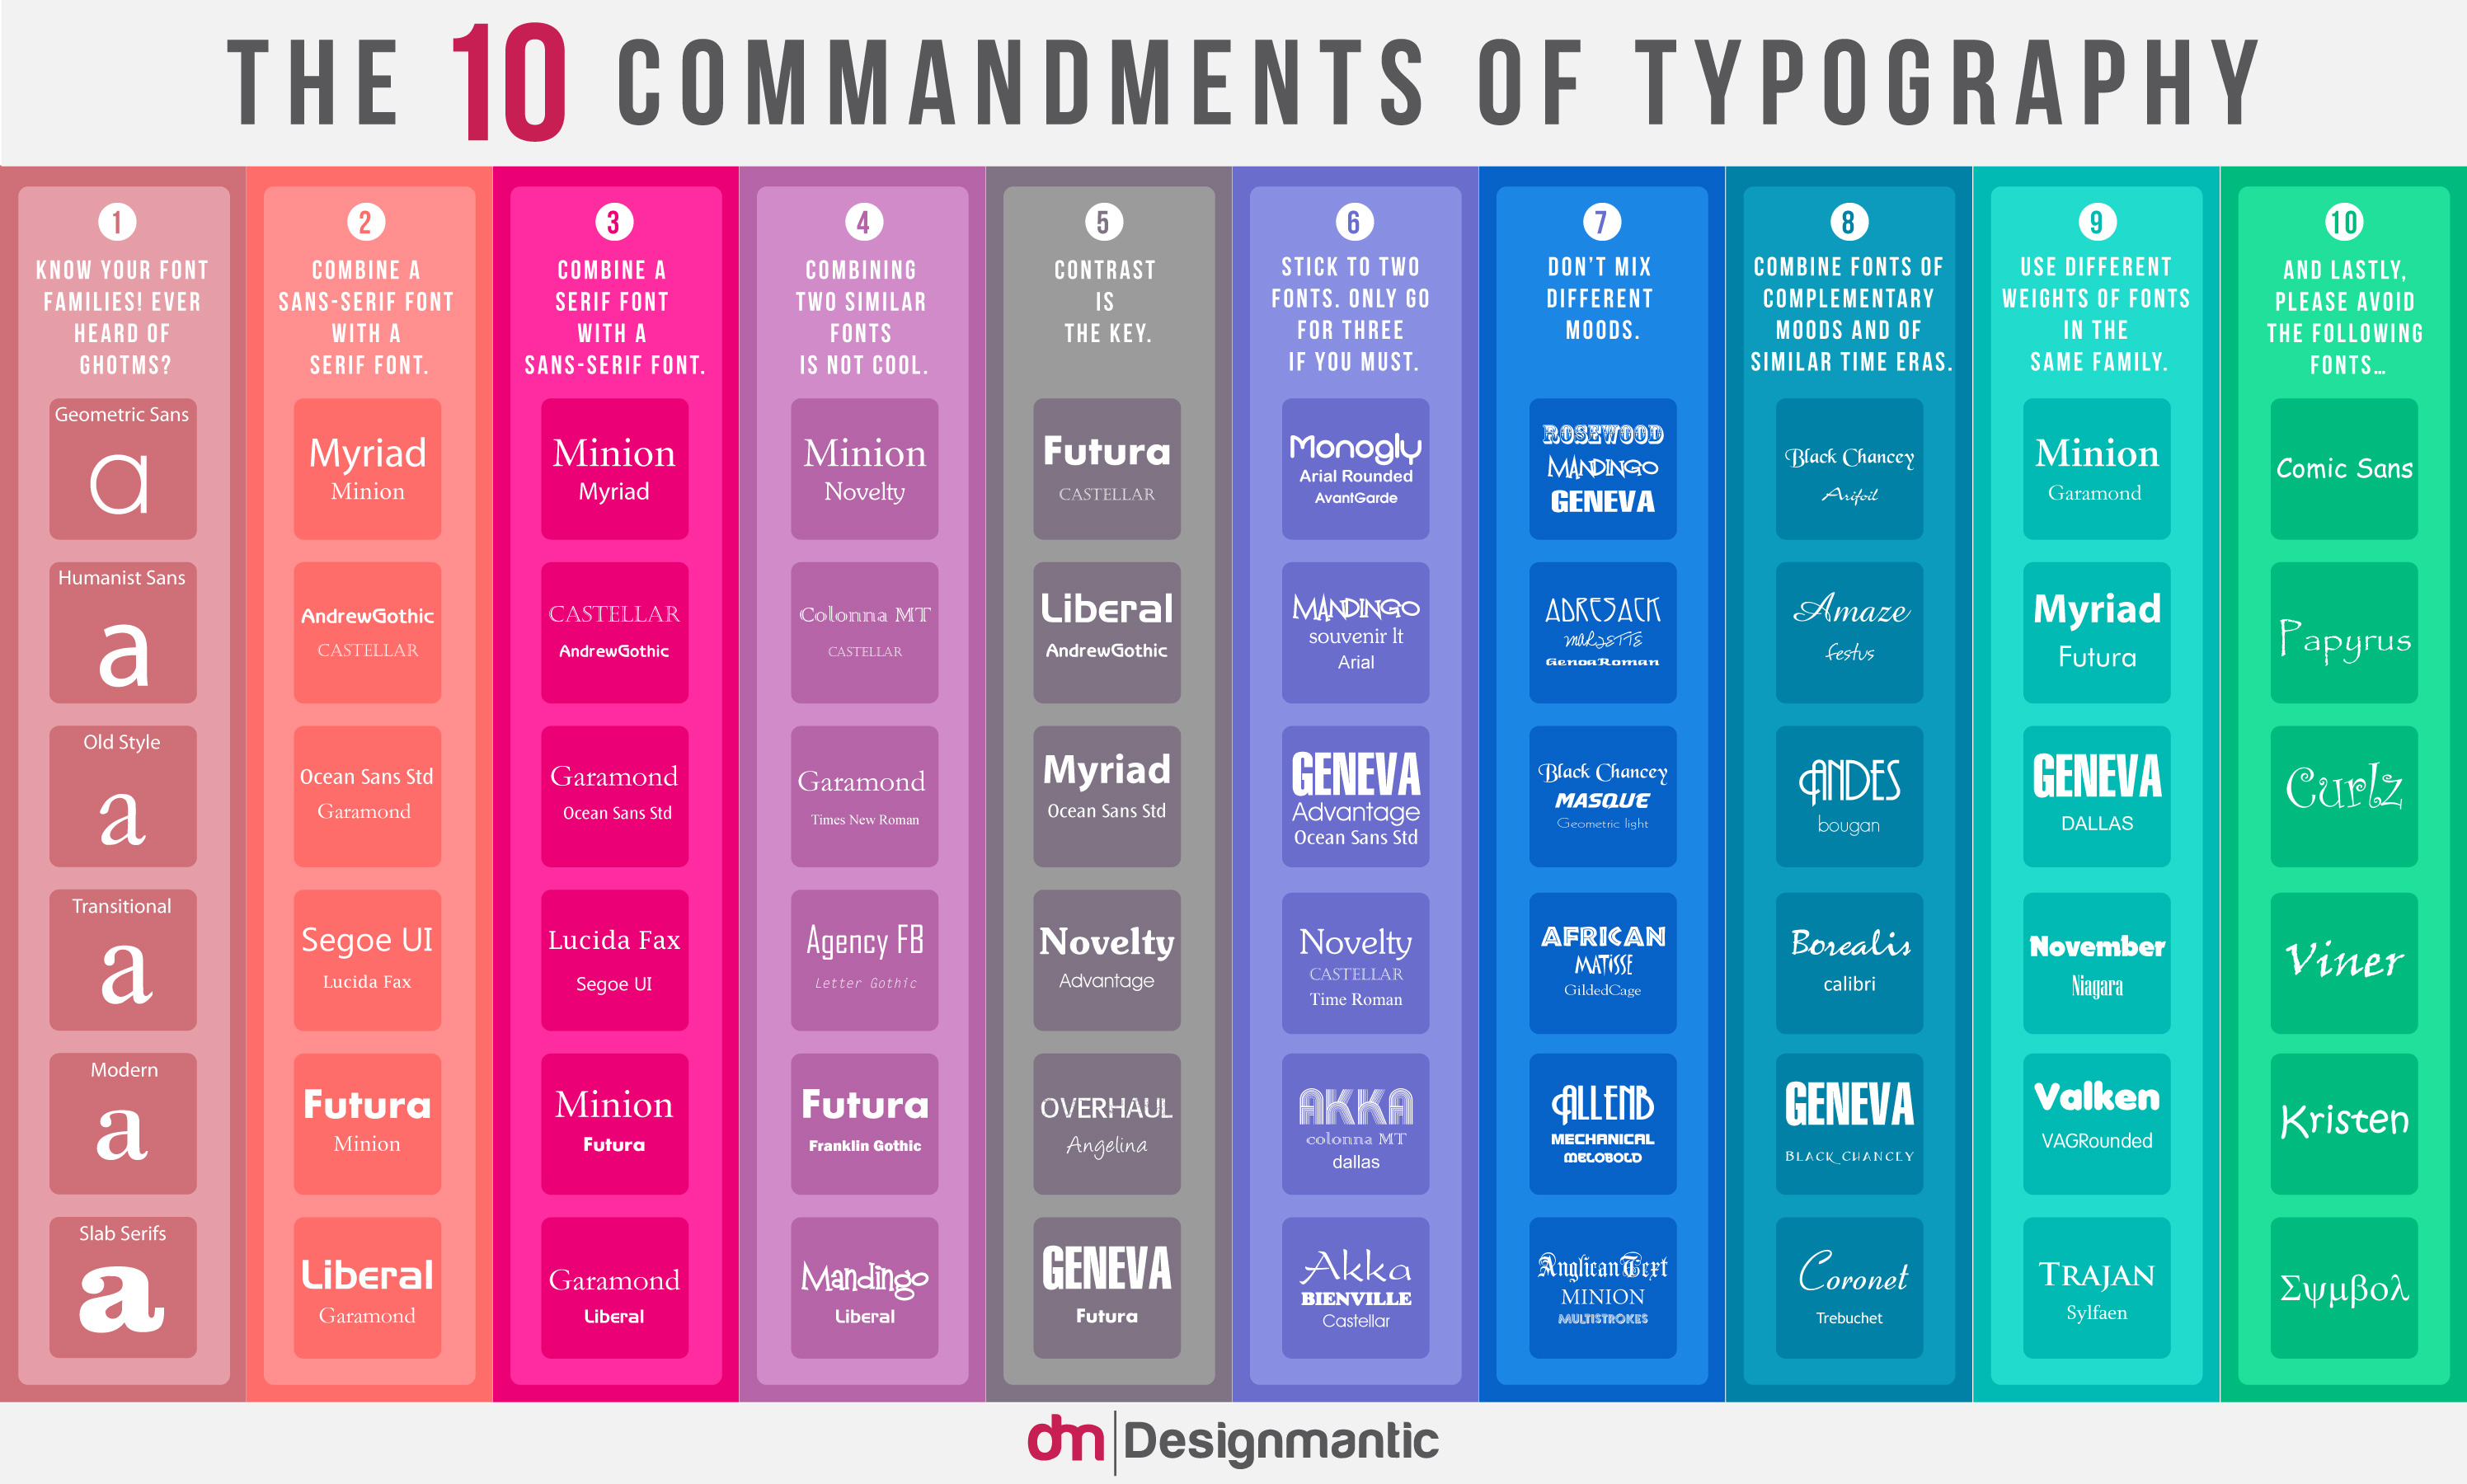
This infographic from Evan Brown at DesignMantic type nerd's dream. If you've ever found yourself aimlessly scrolling through lists of the best free fonts, this cheatsheet will help you refocus your search by providing some key rules. 

The best instruction infographics

26. 9 Productivity Mistakes you're Making in the First 10 Minutes of Your Day
Productivity infographic

Click the image to see the full version (Image credit: https://resume.io/blog/top-9-productivity-mistakes)

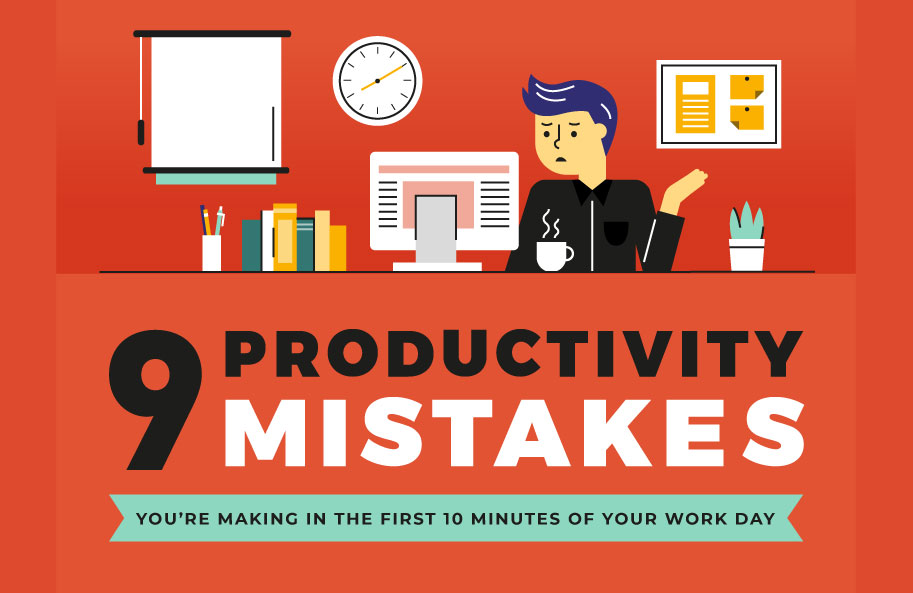
The first 10 minutes of your day can make or break it. This clear and engaging infographic from Impact uses bold illustration to tell you how (and how not) to use those minutes to boost your productivity for the day ahead. 

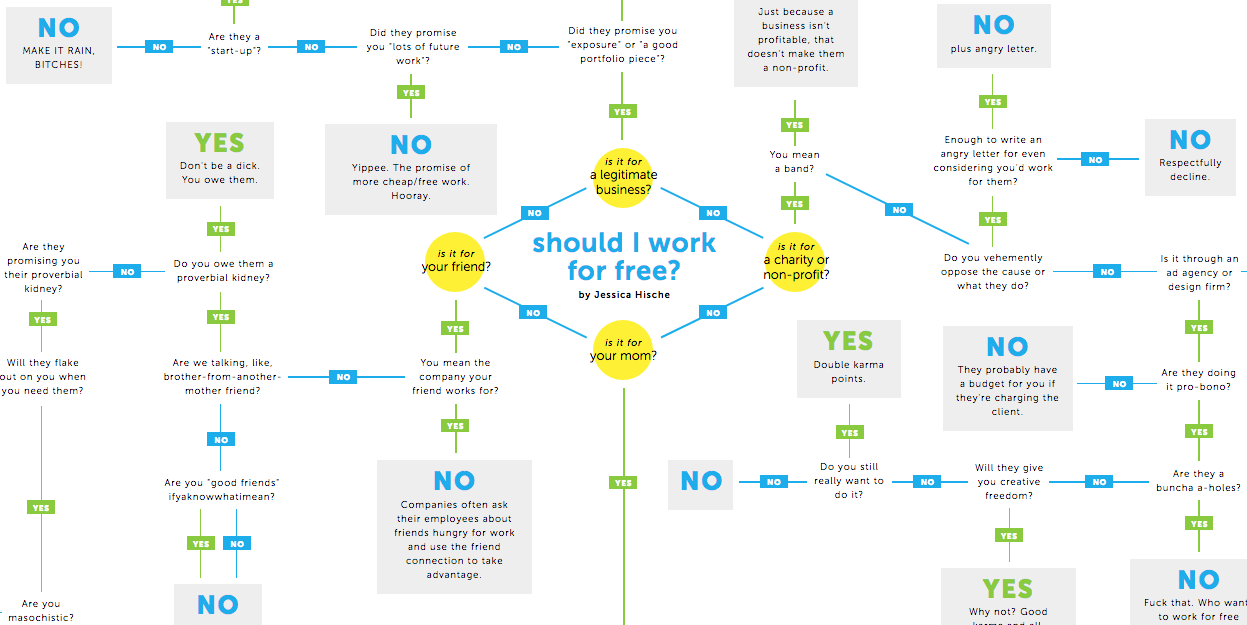
27. Should I Work for Free?

Click the image to see the full version

One of the best infographics to ever go viral, this tongue-in-cheek creation by Jessica Hische is every bit as relevant today as when it was created in 2011. It uses the classic flowchart method to address all the possible perspectives on this notoriously thorny and divisive issue, and is built using live text in HTML and CSS to enable translation into any language. If you'd prefer it in a more traditional format, however, it's also available as a letterpress print.

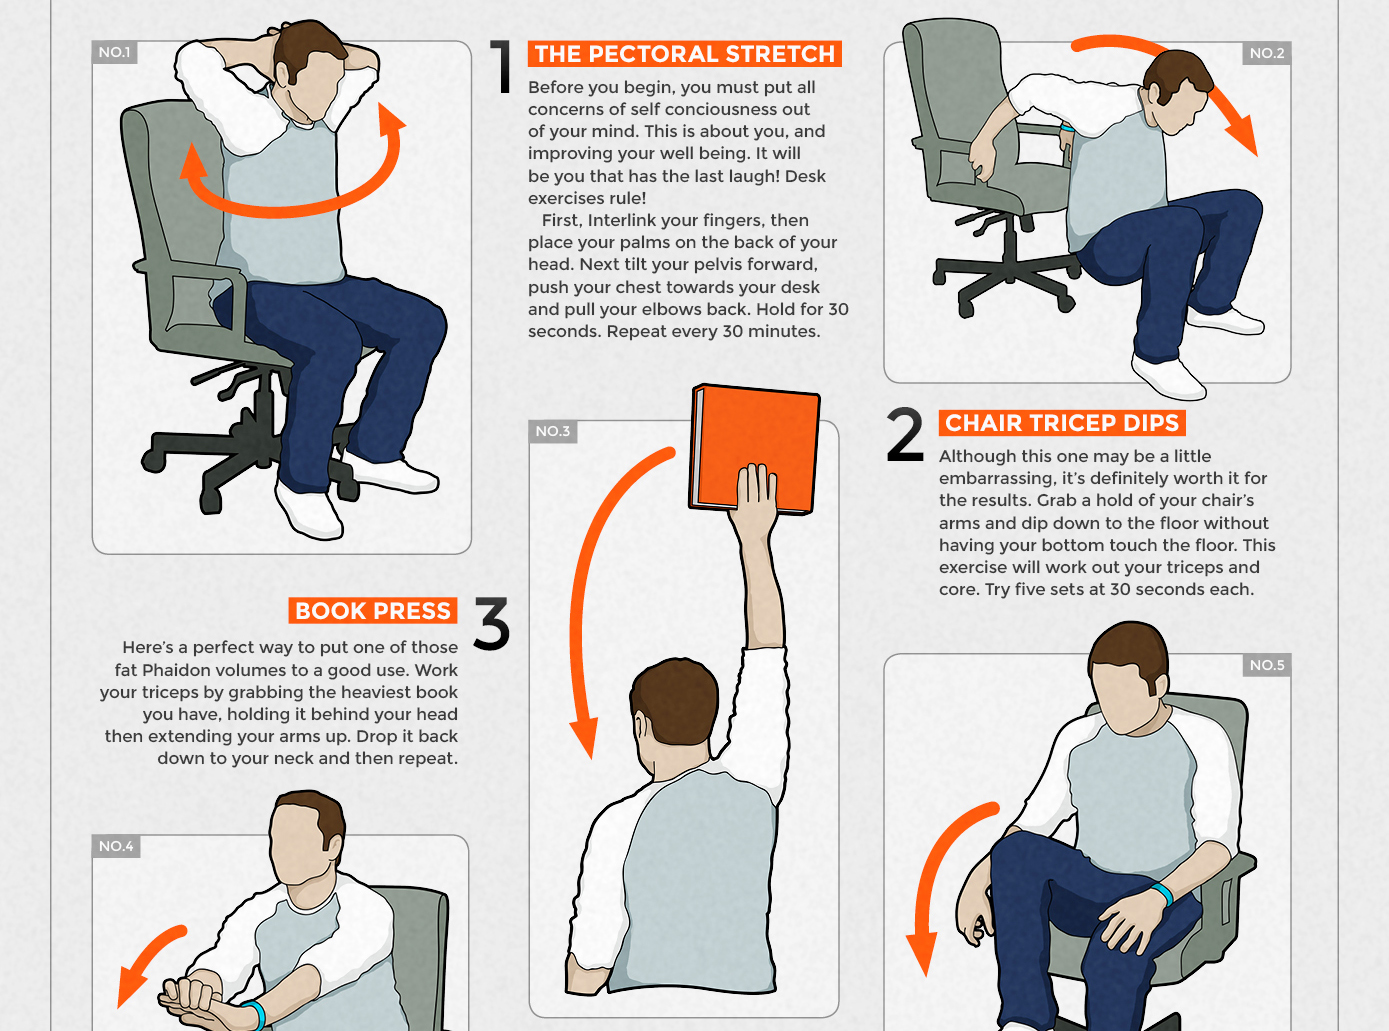
28. Desk Exercises for Designers

Click the image to see the full version

Are you reading this slumped at your desk? You're probably not doing yourself any favours, posture-wise. Sort yourself out with this guide to 10 exercises you can do right at your desk, compiled by us and illustrated by Simon Middleweek. See our post on the desk exercises infographic here.

29. What Font is Best for You?

The best infographics: Which font

Click the image to see the full version

The best infographics make complex information seem fun and readable, and here's a good example. Produced by Cartridge Discount, it takes you on a history of typefaces and acts as a guide by delving into topics such as serif vs sans-serif, web fonts and ones for print, unique fonts and the future of fonts. 

30. Logo Design Principles

The best infographics: Logo design principles

Click the image to see the full version

The best logos may look simple, but break them down into their composite elements and you'll find everything has been carefully chosen to convey something about the brand. This infographic from Online Logo Maker guides designers through the process of creating a logo by breaking down and examining some of the world's biggest brands. 

31. Staying Happy and Healthy at Work

The best infographics: Posture tips

Click the image to see the full version

To live a healthy life as a designer, you shouldn't just be taking breaks; you should be doing everything you can at your desk to ensure a healthy lifestyle. This infographic by Jessica Verster offers some brilliant tips to help your back, neck and shoulders stay in tip-top shape.

The best infographics to make comparisons

32. The Art of Tyranny

best infographics: Theo Deutinger the Art of Tyranny

The Art of Tyranny highlights some gruesome facts in a visually appealing way (Image credit: Theo Deutinger)

The Art of Tyranny is a book filled with infographics of various types, the one above shows the amount of animals killed per second around the world in 2014. Buy the book for more gruesome infographics highlighting some important issues. 

33. Left vs Right

best infographics: Left vs right

(Image credit: David McCandless & Stefanie Posavec)

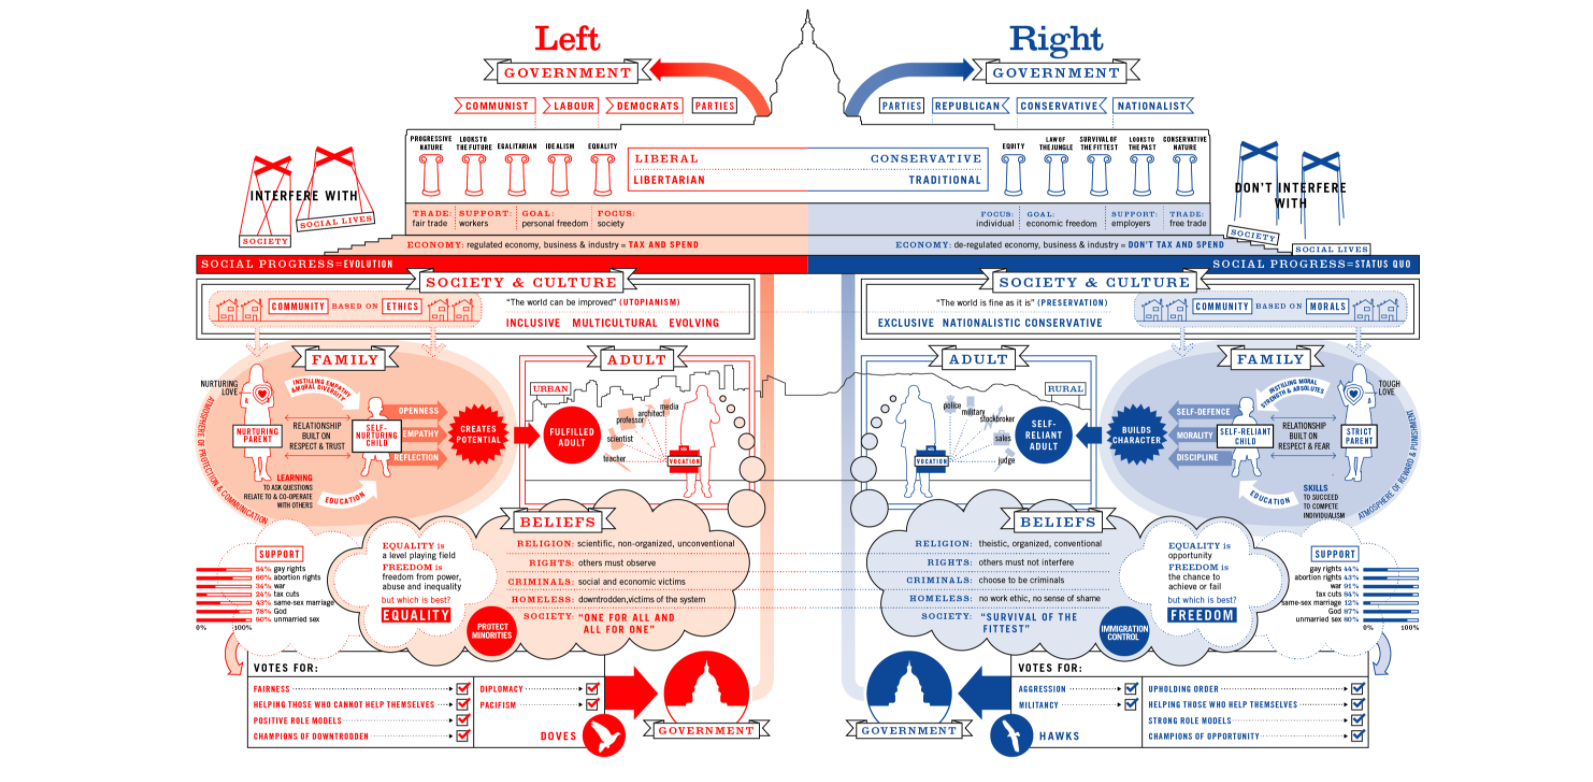
Information is Beautiful is a treasure trove of gorgeous infographics, and this one by David McCandless & Stefanie Posavec shows how the left and right are broadly defined around the world. We think it's a great way of distilling this complex ideology in just a few images.

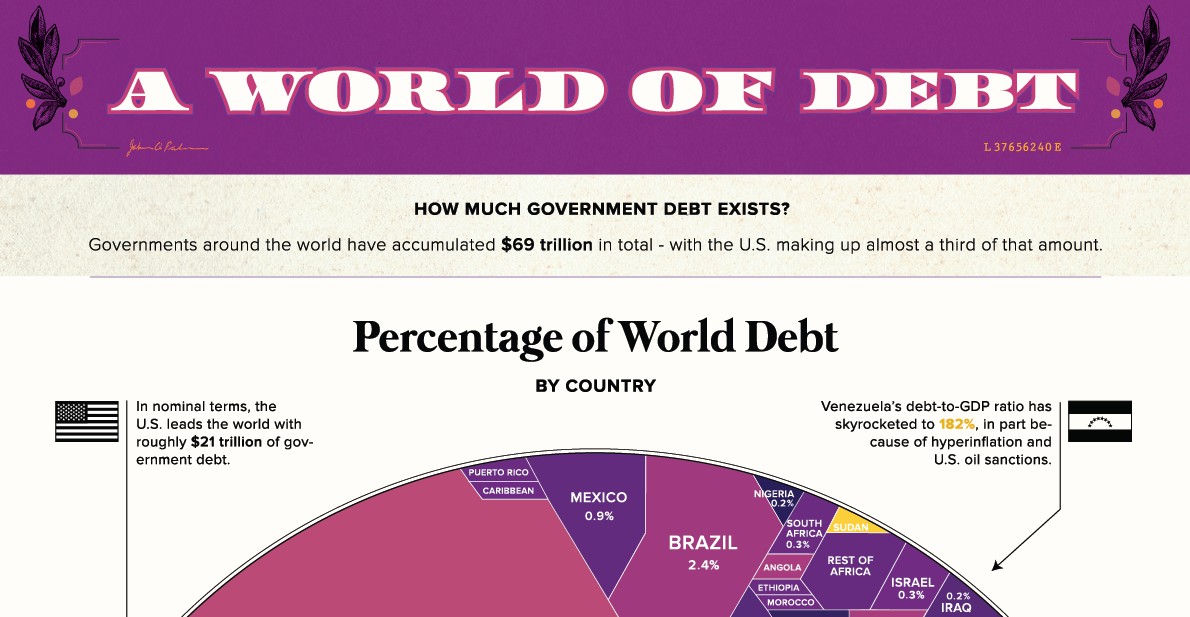
34. A World of Debt

Click the image to see the full version (Image credit: Visual Capitalist)

Whenever you hear about government debt, the figures are always so astronomical it’s difficult to understand what any of it means in real terms. Which makes this infographic from Visual Capitalist quite an eye opener. Visually comparing the amount of governmental debt owed country by country, you’ll probably be very surprised by the disparity in debt across the globe.

35. Superpowers

The best infographics: Superpowers

Click the image to see the full version

This is the third iteration of Pop Chart Lab's popular superpowers infographic, the material sourced from the past 75 years of comic books and broken down into seven main skill sets: powers of the mind, animal powers, mastery, powers of the body, force control, object manipulation and weapons-based.

This vibrant design is seriously impressive, the sprawling taxonomy of over 200 superpowers and 600 superheroes and villains spreading over six square feet. We're also loving the final rendered vintage-style design, which pays tribute to the great cosmic covers of the Bronze Age of Comics.

36. The Chart of Controllers

Click the image to see the full version

One of the best infographics from Pop Chart Lab, this is an extensive family tree of video game control schemes, including handhelds, joysticks, paddles, gamepads, rifles, steering wheels, and even a guitar.

37. Serif vs Sans: The Final Battle

The best infographics: Serif vs sans

Click the image to see the full version

Ever find it hard to choose between serif and sans fonts? If so, this is one of the best infographics to explain the difference. Created by Web Designer Depot, it runs through what type of typography is best suited to different projects. It features a cracking design with cute serif and sans-serif character...err...characters battling it out for supremacy. 

The best infographics that explain a process

38. Photography Cheat Sheet: Manual Mode Camera Settings

Click the image to see the full version (Image credit: Skylum)

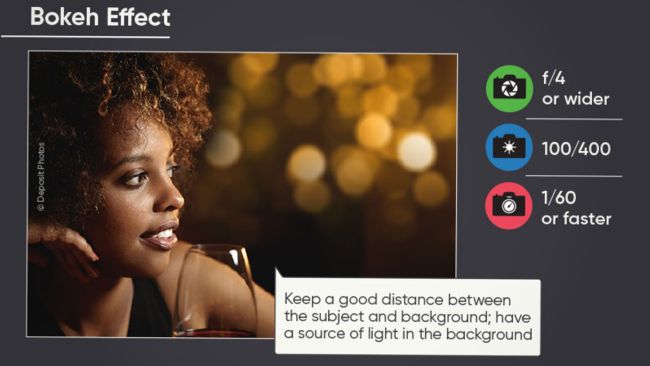
How many of us own expensive cameras, but don’t understand half of the buttons and functions they offer? If you're shooting using the automatic modes then you're probably going to end up with an uninspiring shot. So check out this infographic from Skylum, which explains the three most important things you need to know about manual camera settings: ISO, aperture and shutter speed.

39. Terms Designers Get Wrong

Click the image to see the full version (Image credit: Creative Live)

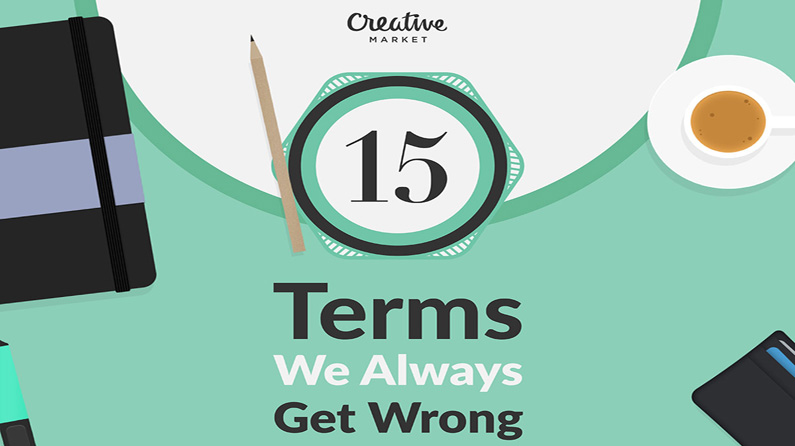
Jargon is a fact of life whatever profession you belong to, but the best infographics can help make the confusing clear. Which is why Creative Market produced this handy guide to the word and phrases that most commonly get mixed up. So whether you get unsure about opacity and transparency, vector and raster, or leading, tracking and kerning, this infographic has you covered.

40. Apollo Missions

Best infographics: Apollo

Click the image to see the full version (Image credit: Paul Button)

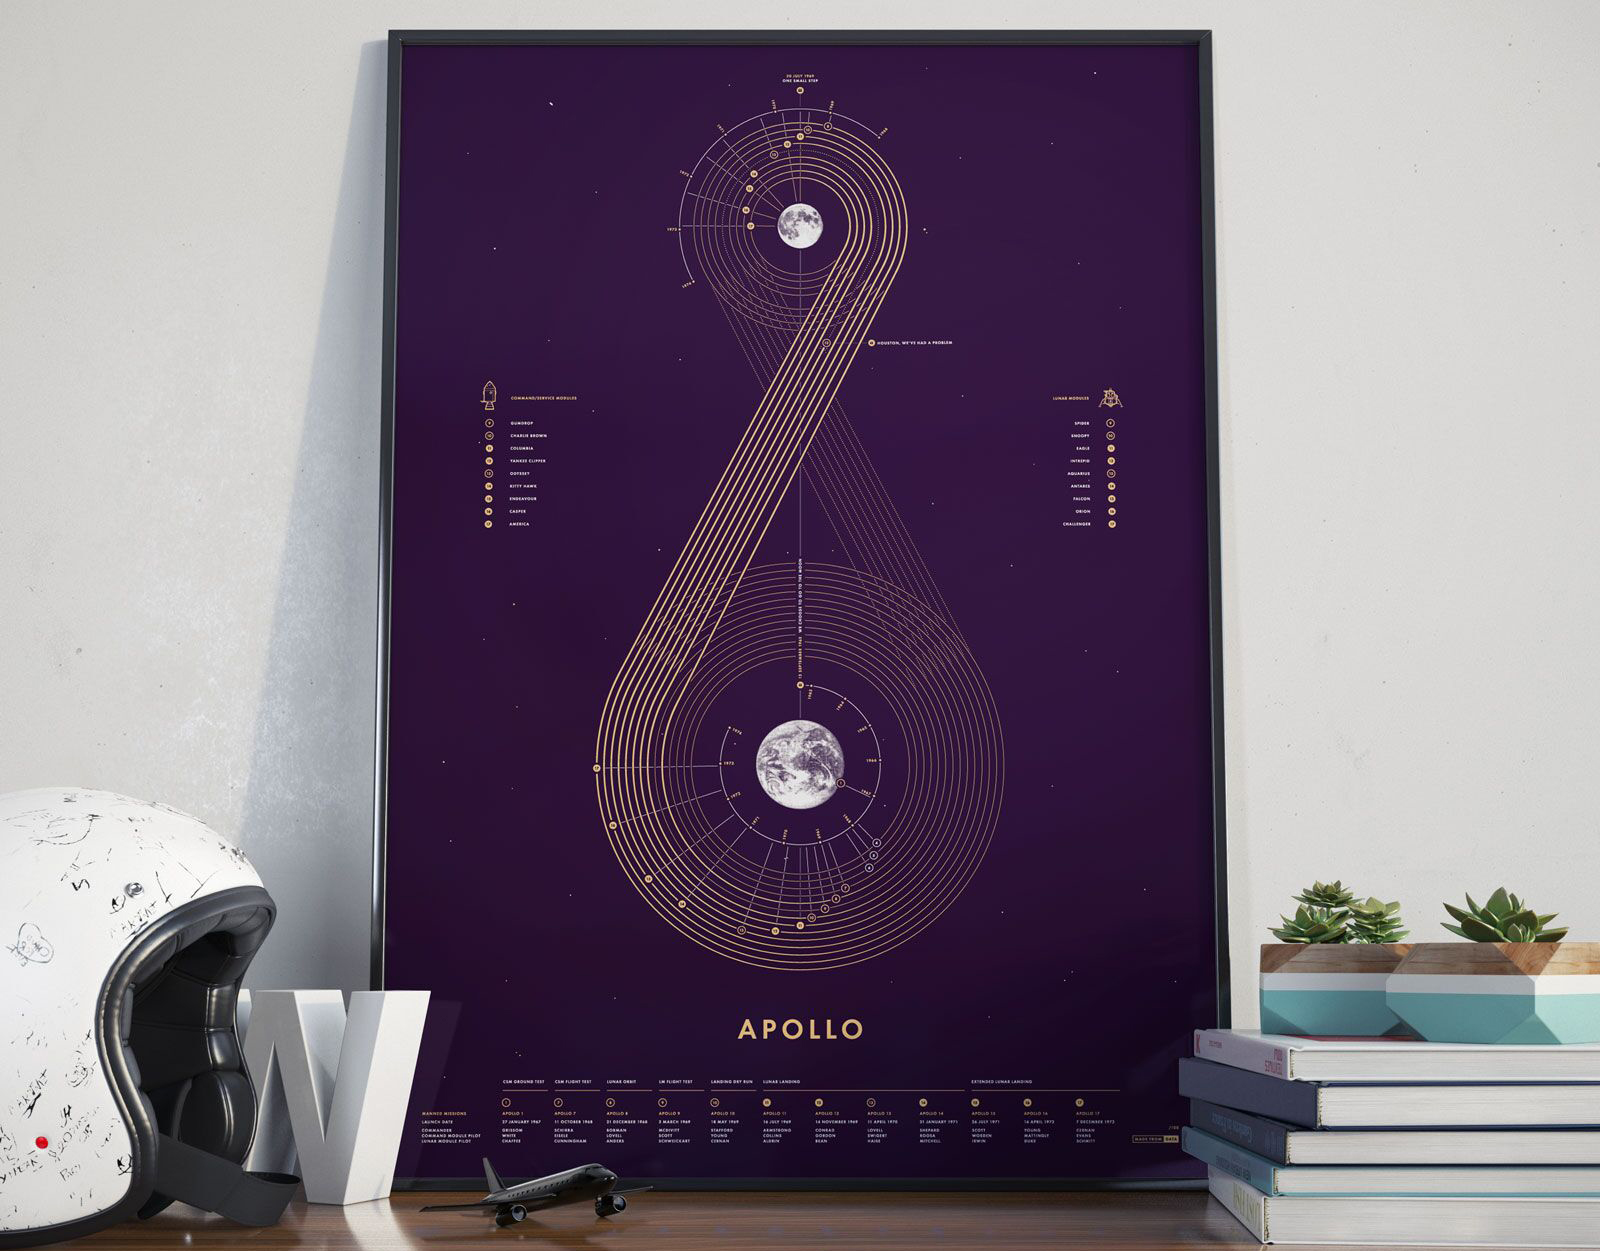
Winner of an 'Information is Beautiful award', which are given to the best infographics, in 2017, Paul Button's stunning visualisation of the Apollo missions charts every manned rocket flight by year, distance and path travelled, as well as which astronauts were on board. It thus explains incredibly complex processes such as calculating different orbits, flight paths and landing zones in a simple, visual way.

41. Distance to Mars

The best infographics: Mars

Click the image to see the full version

Ever wondered how far it is to Mars? Yes, we know that Wikipedia can tell you the exact distance, but once numbers become well, astronomical, it can be difficult to really wrap your head around them. To help you out, David Paliwoda and Jesse Williams' motion infographic, Distance to Mars displays these massive distances in a way that everyone can understand.

42. How Google Works

The best infographics: How Google works

Click the image to see the full version

This detailed visual walkthrough from PPCBlog explores what happens at Google after you add a new piece of content (like this post) to the web. It's all explained using a beautifully old-school flow diagram, complete with biro arrows and a gridded background.

43. How Would You Like Your Graphic Design?

Click the image to see the full version

This venn diagram from Colin Harman hits the nail on the head when it comes to the value (and price) of good design. This simple infographic lays out all the things a client wants, invites the viewer to pick two, and tells them what the outcome will be. How badly do you want to show this to your clients? 

The best infographics for reporting key findings

44. Searching questions

best infographics

Delayed Gratification magazine has lots of infographics to pore over (Image credit: Delayed Gratification)

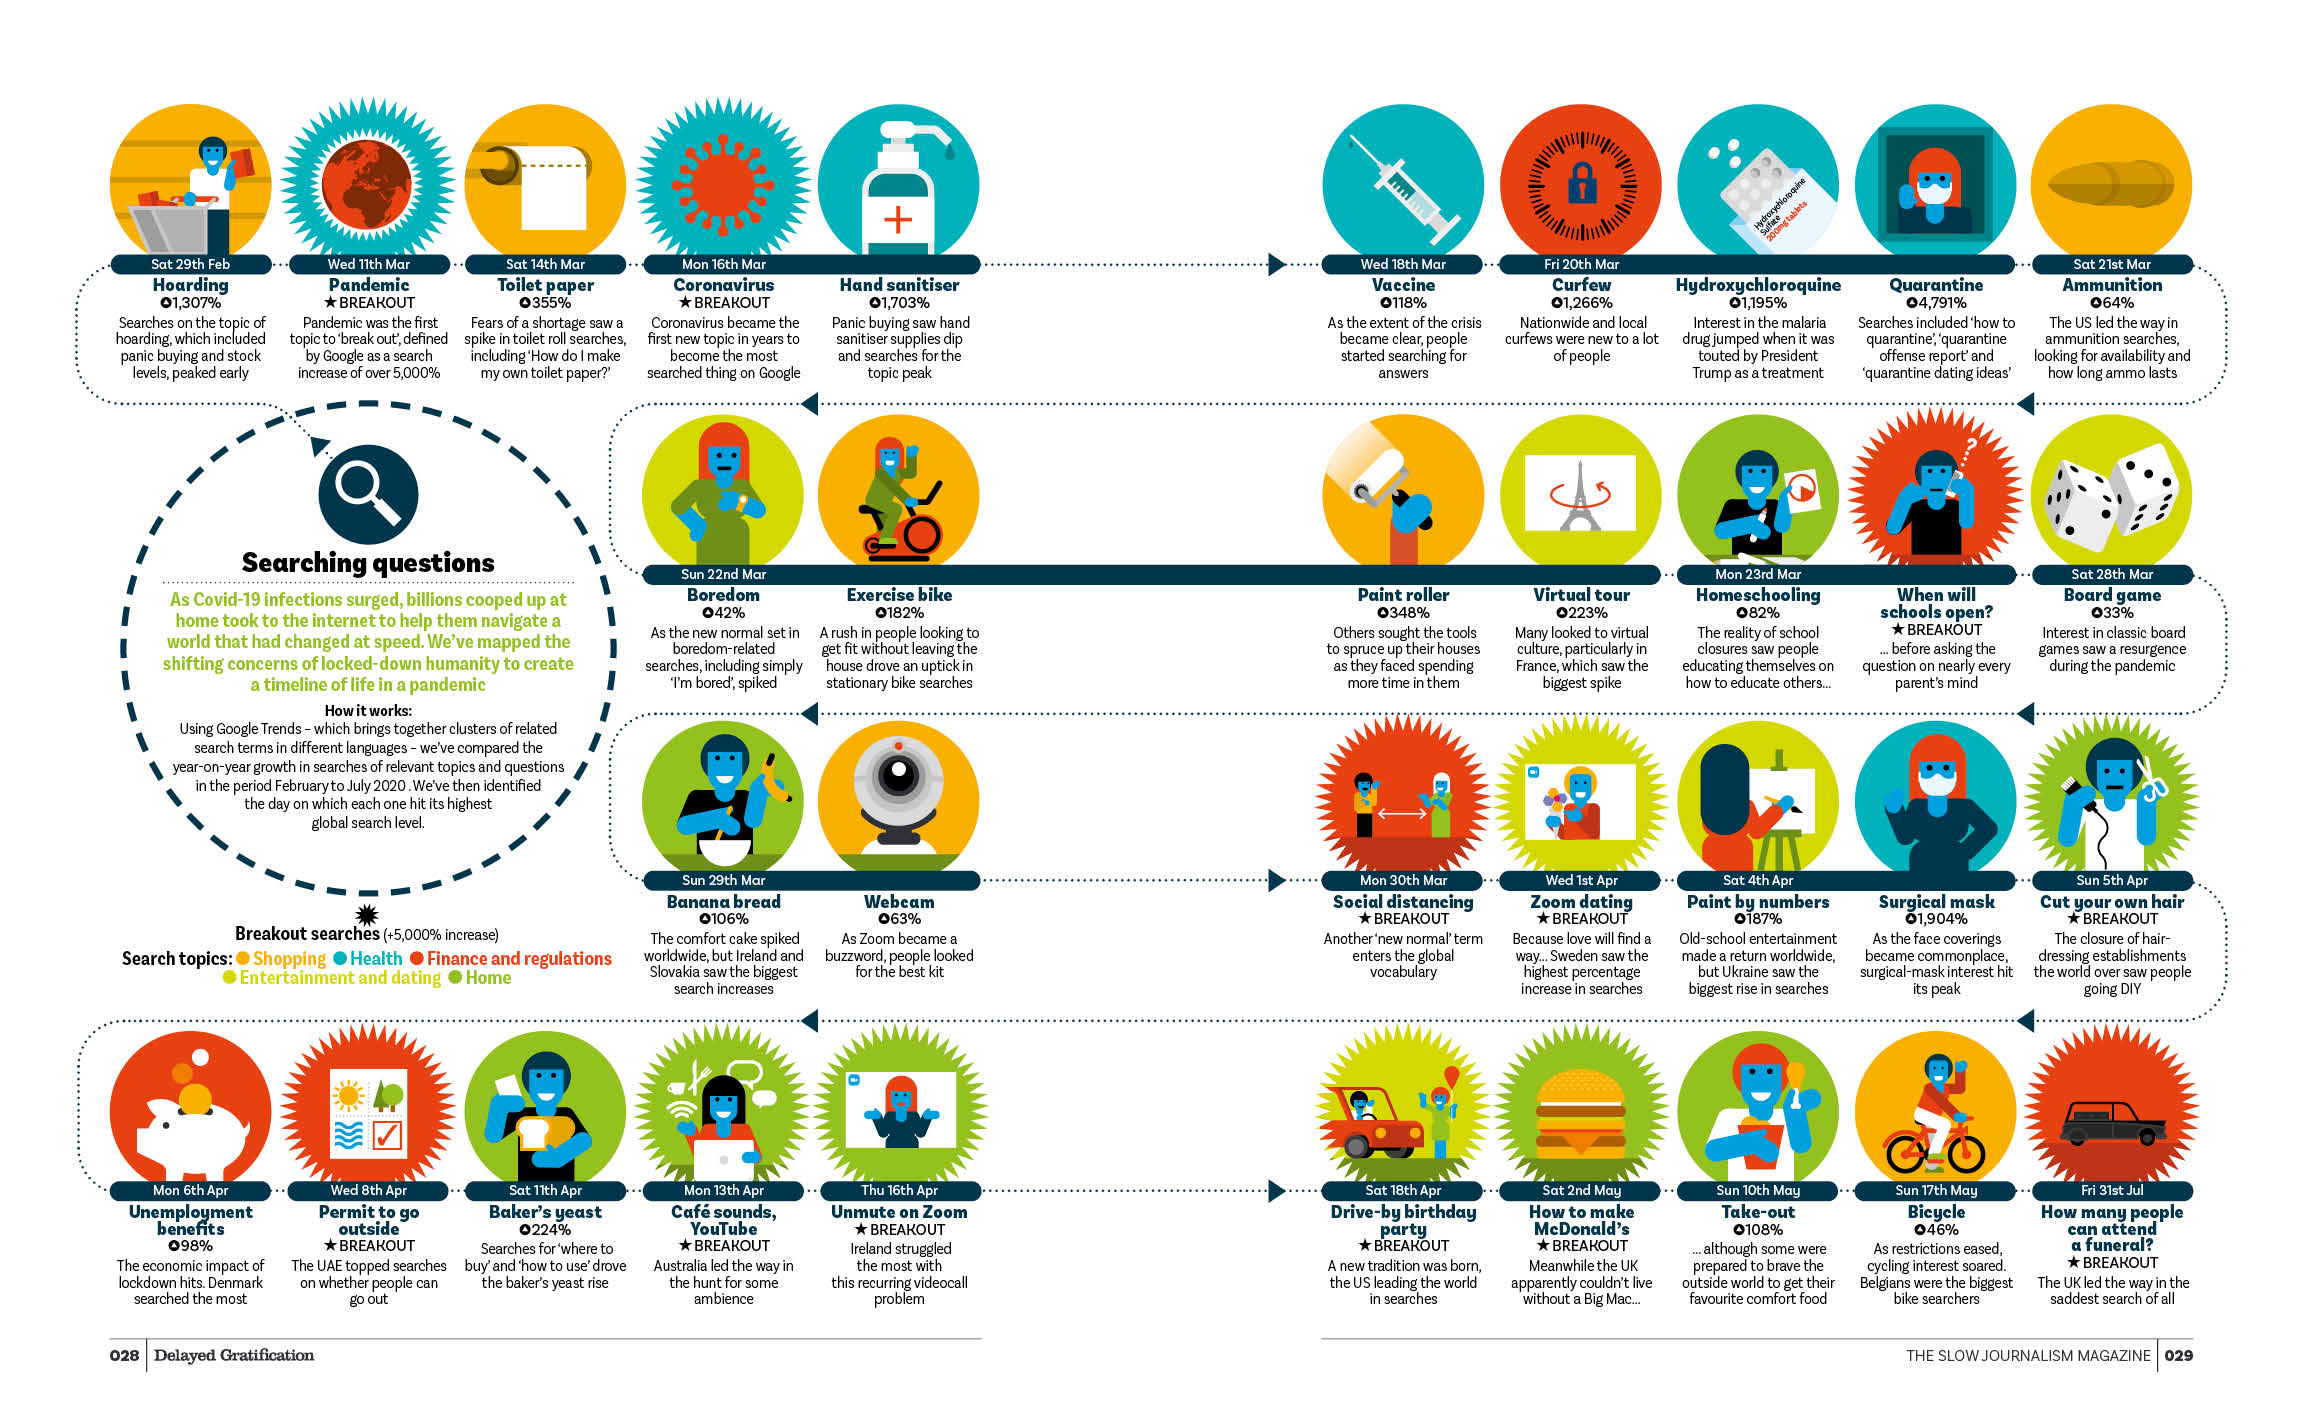
Delayed Gratification magazine is full of interesting and beautifully laid out infographics. The one above shows what the world was searching online for during the height of the coronavirus pandemic from February to July 2020. 

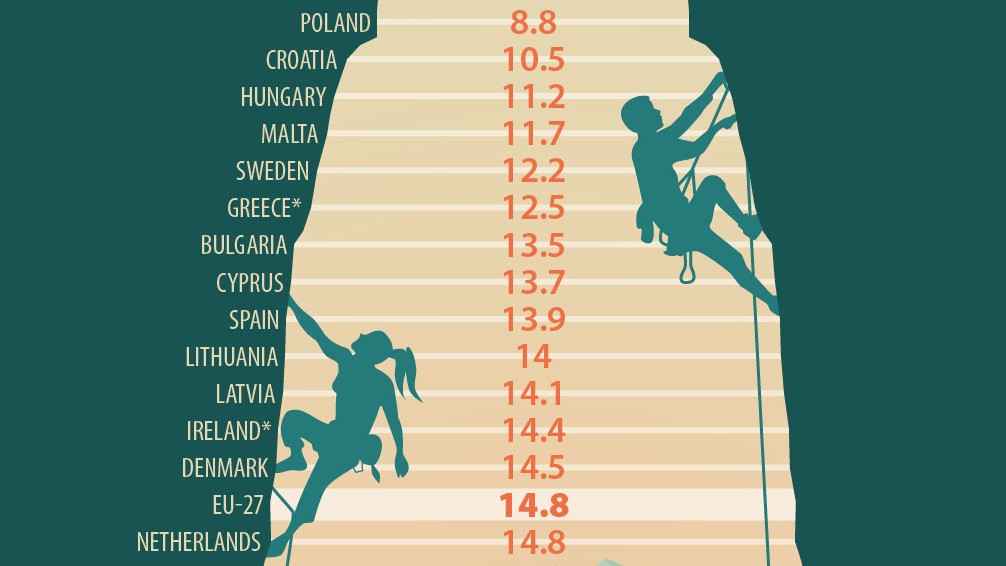
45. Gender Pay Gap by EU Country

Click the image to see the full version (Image credit: European Parliament)

The best infographics can bring dry statistics to life, and bring out the main theme in one knockout visual punch. This great infographic from the European Parliament, focusing on the inequality between men and women in the labour market, uses simple but effective illustrative device to achieve just that. (That said, as the accompanying text makes clear, a narrower pay gap does not necessarily mean more equality; but that’s a whole other article...)

46. Feltron Annual Report

The best infographics: Annual report

Click the image to see the full version

Nicholas Feltron is best known for being a member of the product design team at Facebook, but for 10 years he worked on a personal project called the Feltron annual report. Every year, he released the daddy of all infographics, documenting everything he'd done in the previous 12 months. 

47. Chinese Social Media Landscape

This was illustrator Jessica Draws' first animated infographic. It was commissioned by China Blueprint Online to communicate the benefits of using Chinese social media in Australia, and it's both informative and super-fun.

48. How Green is your iPad?

Click the image to see the full version

This startling infographic, created by the team at Sortable, depicts just how bad your favourite gadget is for the environment. As depressing as the statistics shown are, at least there's light at the end of the recycling tunnel.

49. The Happy Show

Best infographics: The Happy Show

Click the image to see the full version (Image credit: Stefan Sagmeister)

A thought-provoking and interactive infographic exhibition by Stefan Sagmeister, The Happy Show offered visitors the experience of walking into the designer's mind as he attempts to increase his happiness via meditation, cognitive therapy, and mood-altering pharmaceuticals.

The best timeline infographics

50. The Life and Times of Steve Jobs

Best infographics: Steve Jobs

Click the image to see the full version (Image credit: Mashable)

There are plenty of Apple infographics dotted around the internet but this one from Mashable explaining the life and times of Steve Jobs caught our eye. Two threads, dedicated to his life and work respectively, interweave, so you can see how one impacts the other. 

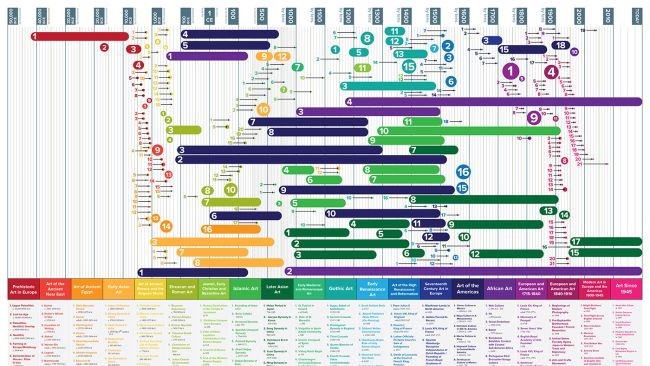
51. The History of Art timeline infographic
Best infographics: Art history

Click the image to see the full version (Image credit: Matthew Cobrin)

One of the best infographics showing a timeline, this design was created by Matthew Cobrin for an Art History class when he was an undergrad at The New England Institute of Art, Brookline, Massachusetts. We love its use of colour, bold lines, and fascinating subject matter. 

The best infographics that simplify complex data

52. All the World’s Metals and Minerals

Click the image to see the full version (Image credit: Visual Capitalist)

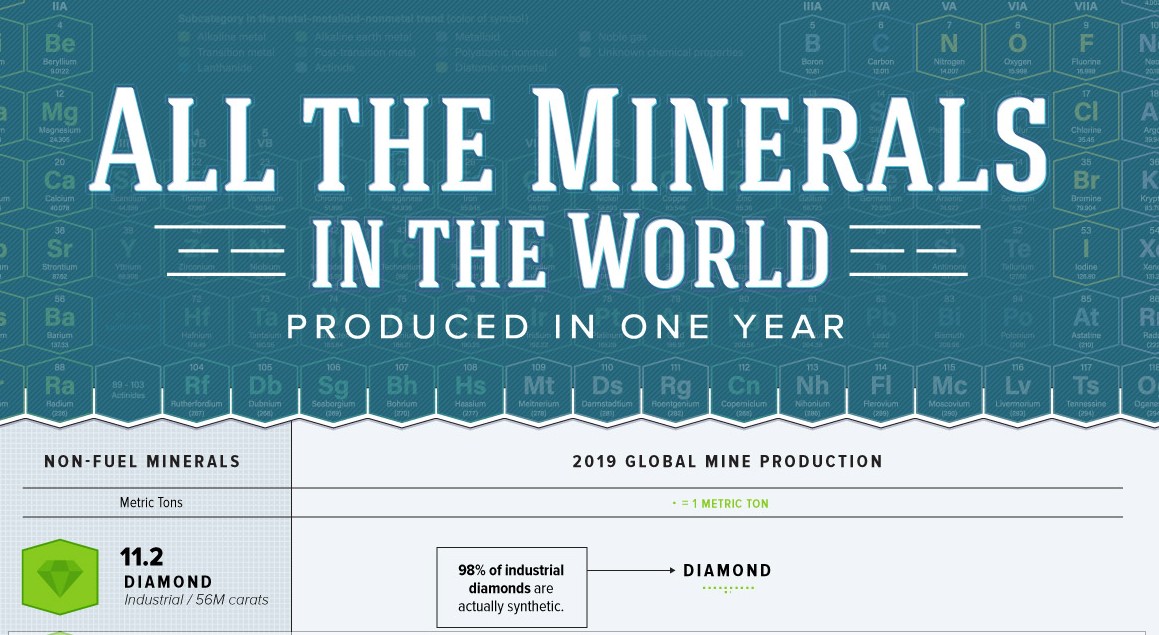
It’s not traditionally something you would think about: what are the buildings we live in, the roads we drive on, and the products we consume actually made of? But in these times of enhanced environmental awareness, these are increasingly important questions, and they’re answered brilliantly in this eye-opening infographic from Visual Capitalist. Note, though, that you really need to scroll to the bottom to get the full impact.

53. Santiago Poster

Click the image to see the full version (Image credit: Poster Santiago)

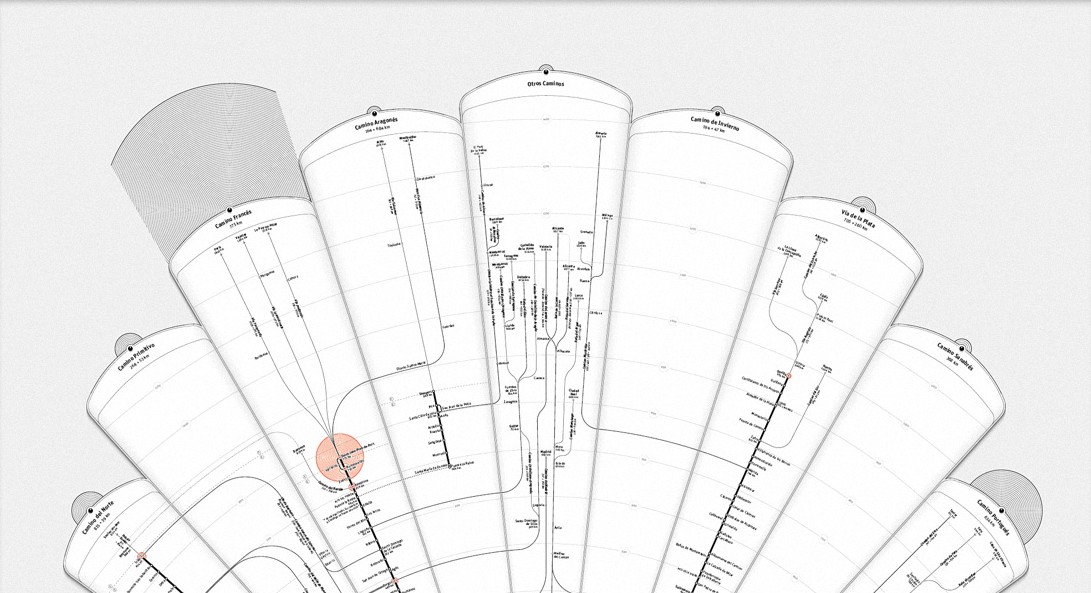
Santiago de Compostela is a city in Spain that's best known for being the culmination of the Camino de Santiago pilgrimage route. This infographic details the routes and identities of those who've journeyed to the alleged burial site of Biblical apostle St. James. It's available to buy as a poster.

54. Imaginary Factory

Click the image to see the full version (Image credit: Jing Zhang)

Illustrator, designer and typographer Jing Zhang has produced some of the best infographics that show how things work. In this recent series, she breaks down the component elements of cameras, iPhones, clocks and TVs as well as coffees, cakes and teapots.

55. Wind Map

The best infographics: Wind map

Click the image to see the full version

One of the best infographics we've seen to harness animation, this wind map shows the delicate tracery of wind flowing over the US. Developed by artists Fernanda Viégas and Martin Wattenberg, it creates a series of beautiful patterns depending on which direction the wind is flowing. You can even zoom in to see more details in a specific area.

56. Dribbble: A HTML5 Interactive Infographic

The best infographics: Dribbble

Click the image to see the full version

This 3D pie chart showing how people use Dribbble is lovely and creative. It's the work of Bristol-based designer Jamie Brightmore, who created his own icon illustrations and brought them to life with CSS3 and HTML5. 

57. Kobe Bryant

Click the image to see the full version (Image credit: J Alexander Diaz)

Even if you're not interested in NBA basketball, you'll have heard of Kobe Bryant, who passed away in January 2020. In 2012 he became the youngest player in NBA history to score over 30,000 career points, and the LA Lakers released this infographic, designed by J Alexander Diaz, which gives you an insight to Kobe Bryant's scoring numbers over the course of 17 seasons.

The best infographics for how-to guides

58. How to use Colour and Typography in Marketing

Click the image to see the full version (Image credit: MDG Advertising)

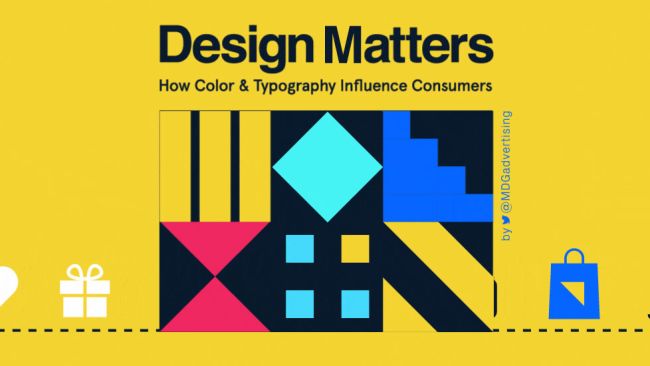
There’s a lot of talk about the cultural meaning of different colours and how this can be harnessed in marketing, but how much of it is actually true? This animated infographic by MDG Advertising sorts reality from myth, and provides a series of bite-size facts on the subjects of colour and typography in marketing.

59. How to Learn to Draw

Click the image to see the full version (Image credit: Anna Vital)

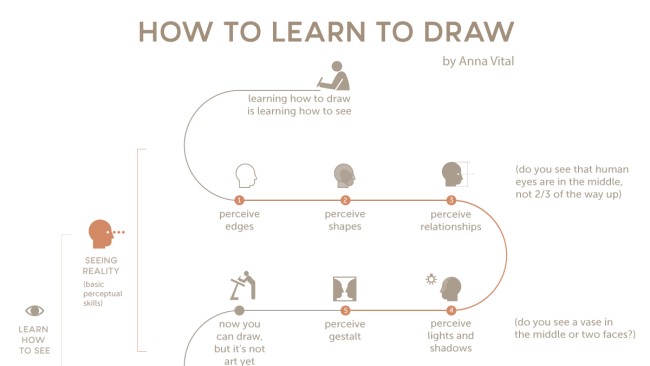
Anna Vital is the information designer behind Adioma, one of the best infographics tools around. And her infographic explaining how to learn to draw is a great example of the tool in action.

60. How to Become a Creative Genius in 5 Days

Click the image to see the full version

Sometimes you need to set yourself new creative challenges. So Zippi has produced this great infographic that shows you how to start making your masterpiece in less than a week. It's full of tips on how to get inspiration, tackle creative blocks and promote yourself.

Click the image to see the full version

Want to design the perfect logo? Then this logo design infographic from Company Folders has some good advice for you. This infographic features a great checklist you can use to see if your designs are on the right track.

62. Accessibility Challenges in Email

The best infographics: Email accessibility

Click the image to see the full version

Making designs are accessible to people with disabilities is a win for everyone, and this infographic from Litmus explains some of the things you need to do to ensure this. Subject range from colour blindness to neurological disorders, and there are some eye-opening stats to show the proportion of the population you'll be excluding if you don't pay heed to these rules.

63. How to Be a Superhero

The best infographics: Superhero

Click the image to see the full version

Want to be a superhero? This adorable infographic from illustrator Zia Somjee shows you how you can acquire a back story, a secret identity and even an arch-nemesis. Whether you're concerned about which colour spandex you should opt for or how you'll go about finding your superpower, look no further.

Inspired? For tools for making infographics, see our pick of the best graphic design software. And if you need tips for your workflow, see our roundup of Adobe Illustrator tutorials. We also have a pick of the best collage maker tools.

Thank you for reading 5 articles this month* Join now for unlimited access

Enjoy your first month for just £1 / $1 / €1

*Read 5 free articles per month without a subscription

Join now for unlimited access

Try first month for just £1 / $1 / €1

Georgia Coggan

Georgia is lucky enough to be Creative Bloq's Editor. She has been working for Creative Bloq since 2018, starting out as a freelancer writing about all things branding, design, art, tech and creativity – as well as sniffing out genuinely good deals on creative technology. Since becoming Editor, she has been managing the site on a day-to-day basis, helping to shape the diverse content streams CB is known for and leading the team in their own creativity.