How to use Chrome developer tools to test layouts
Use Chrome Developer Tools' features to try out possible layouts.
Sign up to Creative Bloq's daily newsletter, which brings you the latest news and inspiration from the worlds of art, design and technology.
You are now subscribed
Your newsletter sign-up was successful
Want to add more newsletters?
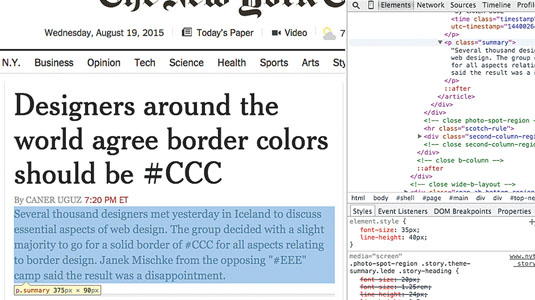
You've been there before. After several long days of work, you're sitting with a customer and he's pointing to the colour of the border and asking you if it could be a shade darker, or maybe a little more blue? You take your vague instructions and go back to the drawing board. Or maybe you are a frontend developer and the layout of the page does not look quite right with the actual live data you are viewing. How will you know where the problem is? Maybe you will go back to the code, make changes, save, refresh the page, upload to your test server and test it with that data again.
What you need is a CSS and HTML editing tool that gives you immediate previews and works right in the browser environment. Chrome provides a large number of tools for developers, and some of them are designed to address design-related issues such as these. In this tutorial we'll go over some of the features of this set of amazingly helpful tools.
To use the Chrome Developer Tools, open your website in a Chrome browser and click the hamburger menu icon in the top right. Chrome hides this feature under More Tools > Developer Tools. Clicking this will open a panel on the side or bottom of your window. You can also use alt+cmd+I to open it, or right-click on any element on the page and select 'Inspect Element' from the menu.
Article continues below 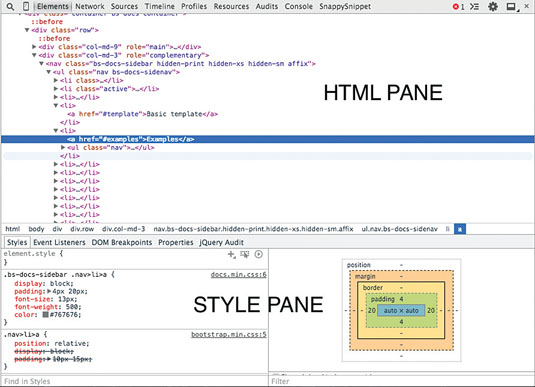
When you open the Dev Tools for the first time it may look crowded, but we're going to work with a few specific panes. The HTML pane includes the HTML source code. You can edit, move and remove HTML elements directly in this pane. The style pane includes all the style-related information.
Editing styles
The style pane includes all CSS styles that apply to the element that is currently selected. If you opened the Dev Tools by right-clicking the element, that element will be selected. If you opened it using another method, the body tag will be selected.
Here you can see what styles have been applied to your element from anywhere that has influence on the element. Take a look at the style rules listed (scroll all the way down). Here you will observe a few important points.
Sign up to Creative Bloq's daily newsletter, which brings you the latest news and inspiration from the worlds of art, design and technology.
Order of application
The style rules you are looking at are ordered based on the specificity of these styles. This is immensely useful because you can see which rules override the others. In most troubleshooting cases, if your style is not being applied you need to look here to see if it's being overridden by another rule.
Colour picker
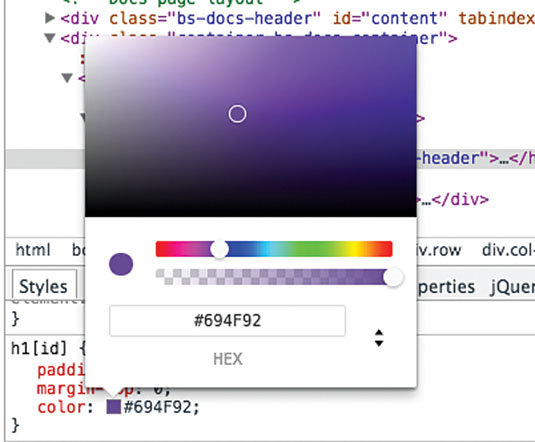
Whenever a colour is involved, the style pane will show a small box with that colour. Click the box to open the colour picker, which you can also use to adjust opacity. For extra wow-factor, move your mouse outside the colour picker. You will see that your pointer is able to select any colour within the browser, making it easy to match colours in your design.
Enable/disable
As you hover over rule sets you will see that Chrome shows checkboxes next to the styles. It is possible to click on these to enable or disable the styles. You'll find this is much easier than removing a style and then trying to remember what it was when you want to enable it again.
Edit styles in place
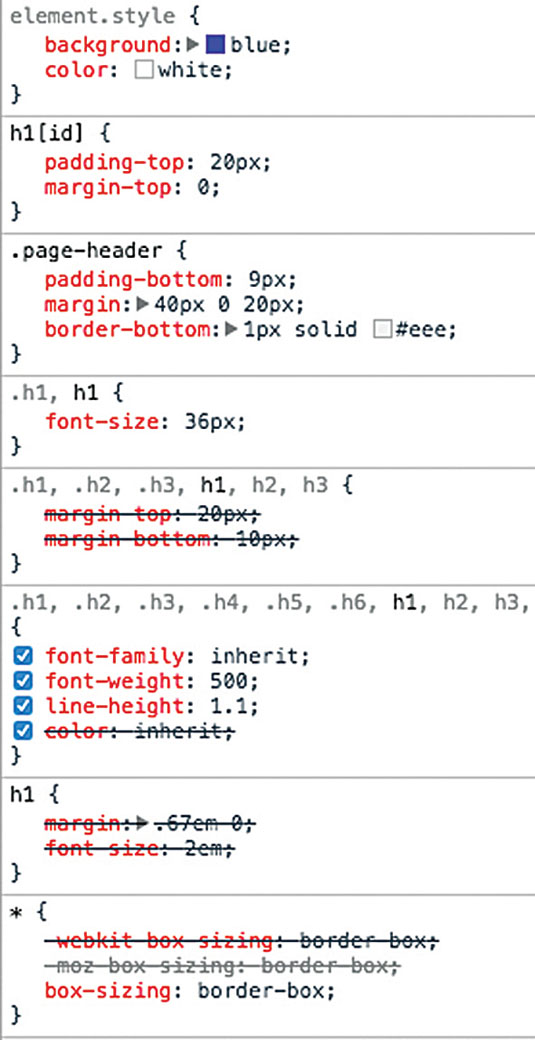
Dev Tools has in-place editing, which means you can click on any rule and it will turn into a box with the contents highlighted. You can then edit any part. As soon as you make a change to a number or rule, the results will be shown on the page.
Add new rules
You can create new rule sets by clicking on the 'plus' (+) icon in the top-left of the styles pane. This will create a new rule set with as specific a selector as possible. You can then add rules or change the selector itself.
Map to source
For each rule set you will see a file name in the top-right corner (e.g. 'base.css' ). This tells you where that rule is originally defined so you know where to make your changes. These file names are links that will take you to the file itself within the Dev Tools, where you can edit the rules.
These tools provide great insights and information, but you are really here to edit these styles and see your changes live. There are several ways you can do that.
The box model
When you open the styles pane you will see the element represented with a box that has margin, border and padding information displayed for all sides. You can check this visual representation to make sure your spacing is accurate, and even double-click to change those values in place.
Show inherited properties
Just below the box model visualisation you will see a section that lists all calculated rules for that element. Click on the checkbox titled 'Show Inherited Properties' to make the style pane show rules that are not set but inherited from the defaults. This may be vital to understand where your element is actually taking its values from.
Editing HTML
So far we only looked at the style pane. However the HTML pane is not just the static source code. It is in fact editable in place, just like the style rules. Sometimes adding or changing CSS is not enough and you need to change the layout structure of the page or add class names to certain elements. There are several handy alterations you can make to existing elements on the page.
Select elements
You can click through the structure of the HTML code to open and select elements, but the faster method is to click on the magnifying glass icon in the top-left to turn on inspect mode. You can then hover over elements to highlight them, then click on them and they will show up in the HTML pane.
Move or delete elements
You can drag and drop any of the elements into any other position on the page. To remove an element, simply select it and hit the Delete key, or right-click and select Delete. If you delete something by mistake you can undo with standard undo commands.
Edit HTML
If you have a large number of edits to do on an element's HTML code, you can simply right-click on the element in the HTML pane and select 'Edit as HTML'. This will give you complete freedom on how to alter the HTML.
Force states
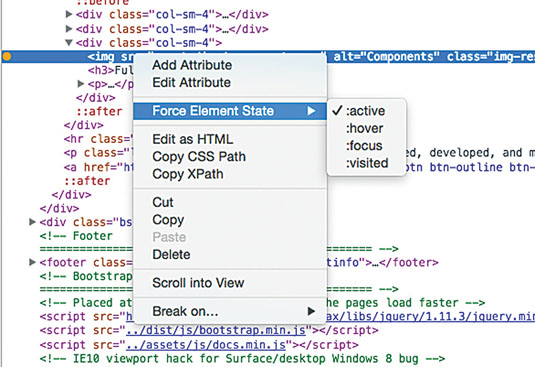
Perhaps one of the most useful features of the HTML and style panes is that you can force states such as hover or active. This makes sense because hover styles, for instance, won't appear in the style section unless the element is forced to that state.
In the HTML pane, right-click an element and select 'Force Element State'. An orange dot on the left will indicate that it's showing a state, and the style rules will update to show the pertinent rules for that status.
Emulating mobile devices
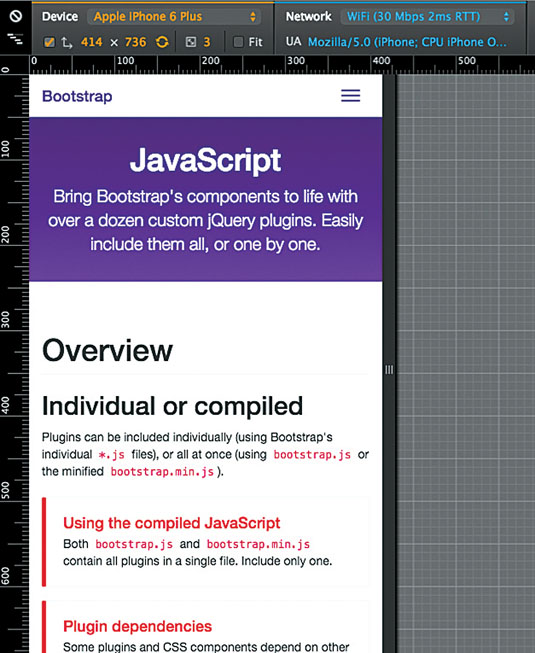
Until a short time ago, you could work with your CSS/HTML and call it a day, but with the proliferation of different device types available to your audience, you need to make sure your website can be viewed everywhere. I don't have space to go into depth on mobile-ready websites here, but your friendly Dev Tools has a cool tool that will help you test your website for the majority of these cases.
Device mode
To the left of the 'Elements' tab at the top of the Dev Tools menu, there is an inconspicuous icon that shows a mobile phone. If you click it you will see your regular website view has transformed into a much smaller view (you may need to refresh for this change to take effect). You are now in the device mode.
From the device selector at the top of you can change which device is being emulated. You can also switch orientation from the device menu, or enter custom sizes. One of the important considerations here is that your window width should be adjusted to reflect the device, which immediately gives you clues about your responsive styles.
You might be thinking that simply making your browser window narrower could also have this effect, but device mode does a few more things as well. Here, user agent information and pixel density changes to reflect the device being emulated. Your hover effects will stop working, since mobile device inputs don't have hover.
You will however have touch action emulations and mobile scroll bars. All these will help you edit your CSS or add conditional CSS that is appropriate for mobile devices. The best part is that you don't need to borrow a bunch of phones and tablets from friends to do it!
Conclusion
We've only looked at two panes so far, and we have already covered a lot of features of the Chrome Dev Tools. I'm sure you are thinking of times in the past you could have used these techniques, or considering their potential for future projects. I recommend using these tools daily to save time and try out ideas before committing to writing any code.
There are two approaches you can take which will help you improve how you work with these tools. If you are starting a new project, code the HTML first and then simply play with the rules and first draft of the HTML through the Dev Tools. You will see that the instant application of your changes will save a lot of time as you refine your project.
Conversely, if you are fixing something or making edits on an existing project, before you go through the code look at the styles being applied and the HTML syntax and see if you can troubleshoot on Dev Tools first. Then try out your initial instincts for possible solutions. You will find that most often this will lead you to the correct fixes.
One final thing: you can quite easily prank your friends with screenshots from reputable online resources. I'll leave it to you to figure out how the Dev Tools can serve this fun purpose; but please use responsibly.
Chrome Dev Tools’ device mode has more features than we could cover here. This five-minute video from Google gets into some of the details.
Words: Caner Uguz
Caner Uguz is a developer at the Center for Open Science. This article was originally published in issue 273 of net magazine.
Liked this? Read these!
- How to build an app: try these great tutorials
- Free graphic design software available to you right now!
- Download the best free fonts
The Creative Bloq team is made up of a group of art and design enthusiasts, and has changed and evolved since Creative Bloq began back in 2012. The current website team consists of eight full-time members of staff: Editor Georgia Coggan, Deputy Editor Rosie Hilder, Ecommerce Editor Beren Neale, Senior News Editor Daniel Piper, Editor, Digital Art and 3D Ian Dean, Tech Reviews Editor Erlingur Einarsson, Ecommerce Writer Beth Nicholls and Staff Writer Natalie Fear, as well as a roster of freelancers from around the world. The ImagineFX magazine team also pitch in, ensuring that content from leading digital art publication ImagineFX is represented on Creative Bloq.
