The 10 best Batman infographics
The most anticipated film of the year, The Dark Knight Rises, is out today. To mark the launch, we've collected 10 of the best Batman infographics on the web for your delight and enjoyment.
At Creative Bloq, we love a good infographic (check out our article 40 brilliant examples of infographics ). So to mark the worldwide release of new Batman movie The Dark Knight Rises, we've gathered together the very best Batman infographics from around the web.
Covering every Bat-related subject from the Batmobile to the Batsuit to, er, Bill Gates, they're guaranteed to put a smile on your face. Click on the image to see the full-sized infographic, and enjoy!
Spider-Man vs. Batman
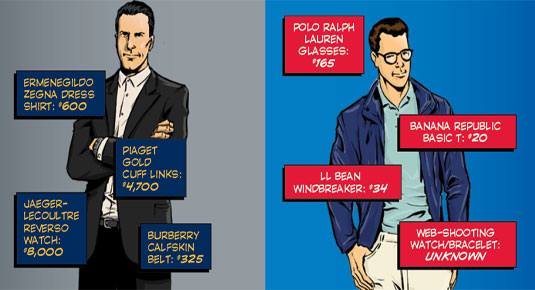
With both The Dark Knight Rises and The Amazing Spider-Man solidifying themselves as the big blockbusters of the summer, there was always going to be comparisons between the two heroes. Opening with: 'This isn't what makes a hero, this is what a hero makes', H&R Block puts a new spin on the Batman infographic with a look at Batman's and Spider-Man's financial earnings.
The old-school comic book-style design makes this infographic an awesome read. However, we all know that Batman is going to outdo geeky Peter Parker on the money-front - so how about a comparison with the almighty Stark Industries from Iron Man? Now, that would be interesting...
Every significant Bat-Suit ever
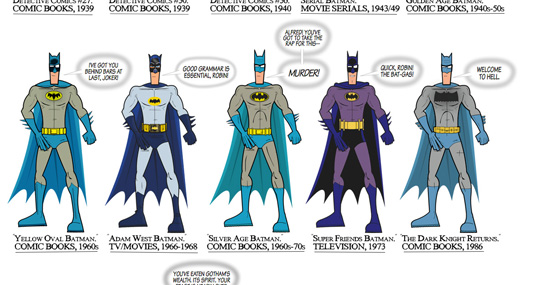
This nifty Batman infographic is created by illustrator and graphic designer Ben Moore. He took influence from comic book writer Grant Morrison, who had said: "[Every bat-suit is] completely different – sometimes insanely different – but they’re all instantly recognisable as [the-bat-suit]". Moore describes Batman as the 'Madonna of superheroes' due to his ever-changing look, and in this infographic, he showcases the more significant bat-suits in the Caped Crusader's history.
Is Bill Gates better than Batman?
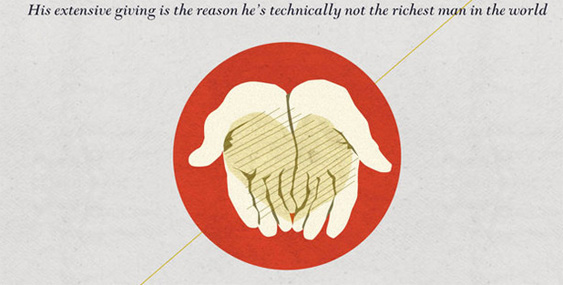
Bill Gates is certainly a hero in the computing world and a celebrated philanthropist, but does that make him better than Batman? This infographic created by the team at Frugal Dad has been creating quite a stir on the internet, with many claiming that it's silly to compare the two. We at Creative Bloq think that no matter what your opinion on the content, the design of the infographic is stunning. The inspiration to create it came after Jon Stewart of The Daily Show called Bill Gates 'Batman' after discussing his philanthropic work. What's your verdict?
The evolution of the Batmobile
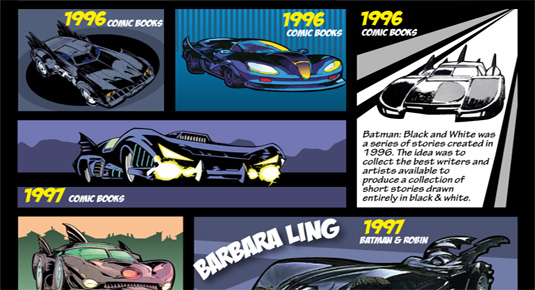
One of the things that makes Batman one of the coolest superheroes is his Batmobile. How else would he embark on high-speed chases through Gotham's streets? How else would he impress the ladies? The uber-vehicle's design has come a long way, both in comics and movies, and we can't wait to see the latest version in action (there's a sneaky glimpse of it in the official The Dark Knight Rises trailer). This infographic from Car Insurance charts just how much Batman's trusty Batmobile has changed throughout the years.
Daily design news, reviews, how-tos and more, as picked by the editors.
Notable events in Bat history
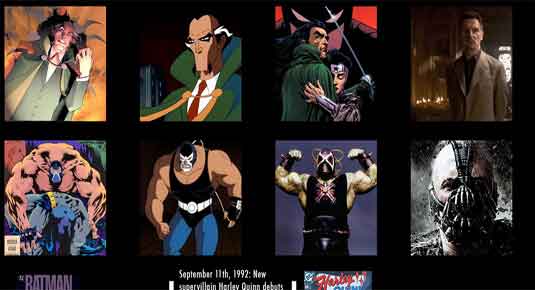
This infographic designed by Gonzo Blair charts notable characters and events across 70 years of Batman history. There's a look at the Joker, Two Face, Catwoman, Scarecrow, Commissioner Gordon, Ra’s Al Ghul and of course Batman's latest villain, Bane. The clear and consise design makes for a simple and interesting read: we can't quite believe how far the Caped Crusader has come!
Batman: The best-selling Lego game

June 22nd marked the release of Lego Batman 2: DC Superheroes, the hugely anticipated sequel to Lego Batman: The Videogame. It shot straight to number one and looks set to become the best selling Lego game of all time. Warner Bros. interactive Entertainment has created this brilliant infographic spanning the release of the original and its highly-acclaimed sequel. Here you'll discover how many animations it took to create the game; how many fighting combos there are; and how many Lego bricks each character is comprised of.
70 years of Batman evolution

This infographic is brought to you by writer/director Blair Erikson. It showcases Batman's 70-year history, from the character's creation by Bob Kane right through to Christopher Nolan's modern-day movies. This cool infographic features a description of each Batman from 1939 to 2012 and the inspirations and influences behind each design. It also looks at how much cash each Batman generated, too: you won't be surprised to find that Nolan has secured the most!
The real world value of Wayne Manor

Ever wondered how much the Wayne Manor would be worth in real life? Wonder no more! The guys at Movoto have created this cool infographic to chart the businessman's gross assets and house value in today's market. But just how did they calculate it? Controversially, they decided that Gotham City is Chicago and therefore compared similar housing prices. If it were on the market today, Wayne Manor would be worth $32,100,000. It would include 11 bedrooms, 7 baths, and have a total square footage of 42,500. The price per square foot would be $849. And that price doesn't even include the Bat cave...
The myriad monikers of Gotham's villains
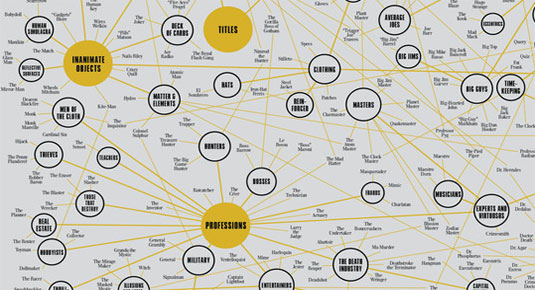
Pop Chart Lab is a design company with a difference. Founded in August 2010 by a book editor and a graphic designer who joined forces to render all of human experience in chart form, they've become a firm infographic favourite here at Creative Bloq, with their attention to detail and incredible design abilities. Here, every single Gotham city villain is showcased, categorised into sections such as 'professions', 'inanimate objects', 'plants' and 'animals'. You can buy a print of this infographic for $22 on Pop Chart Lab's website.
Mental state of Gotham's citizenry
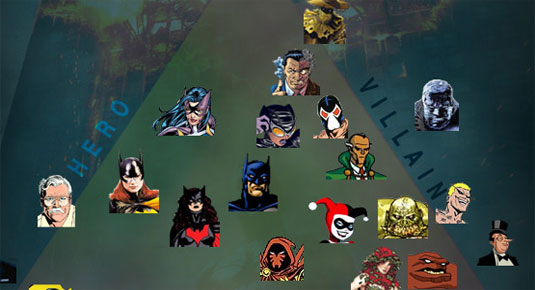
Finally, we have this Batman infographic from designer and comic book creator Brendan McGinley. It's one of the simplest infographics we've come across but that doesn't make it any less awesome. Here, Brendan uses the triangle of personal tragedy, along with 'villain,' 'hero' and 'victim' subcategories, to portray the mental state of Gotham's baddies, goodies and butler.
Have you spotted any awesome Batman infographics? Let us know in the comments box below!

The Creative Bloq team is made up of a group of art and design enthusiasts, and has changed and evolved since Creative Bloq began back in 2012. The current website team consists of eight full-time members of staff: Editor Georgia Coggan, Deputy Editor Rosie Hilder, Ecommerce Editor Beren Neale, Senior News Editor Daniel Piper, Editor, Digital Art and 3D Ian Dean, Tech Reviews Editor Erlingur Einarsson, Ecommerce Writer Beth Nicholls and Staff Writer Natalie Fear, as well as a roster of freelancers from around the world. The ImagineFX magazine team also pitch in, ensuring that content from leading digital art publication ImagineFX is represented on Creative Bloq.
