Hailing from Abcoude, a small town near Amsterdam, Nadieh Bremer’s data-visualisation projects are quite simply a joy to behold. Combining a keen understanding of statistics and the stories they can tell, her work pushes both the aesthetic and the communicative possibilities of this ever-evolving medium to reach new and exciting places.
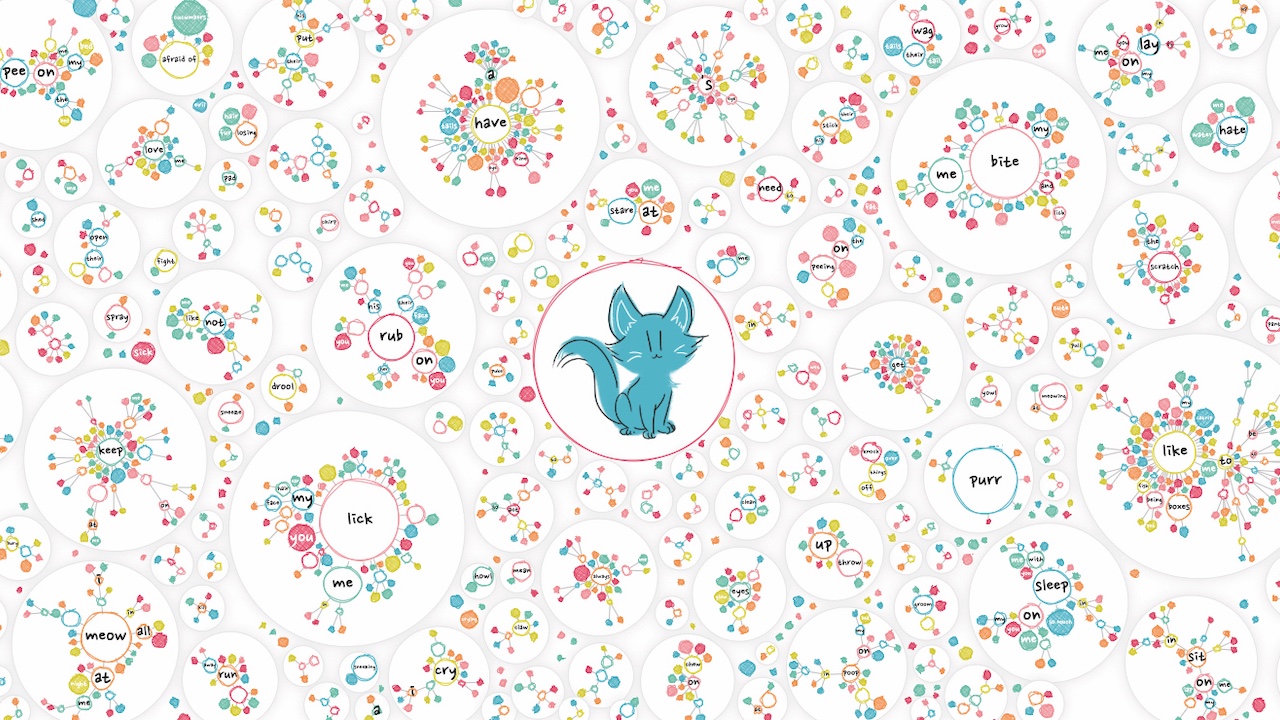
Illustrating everything from the differences between dogs and cats for Google to the absurd number of digital trackers that you gather when you browse the web for the New York Times, her projects have won numerous awards and stand as an inspiration for anyone wishing to pursue data visualisation.
Ahead of her appearance at GenerateJS, the conference helping you build better JavaScript, on 2 April in London, Bremer explains how she made the journey from astronomy to data viz (learn more about data visualisation here), her go-to tools and how she sees the discipline developing in the future.
Could you briefly introduce yourself to anyone who doesn’t know you?
I focus on the ‘creative’ side of data visualisation. I custom-make each visual to fit the data, goal and topic and love to spend time experimenting with the design side of things to make the eventual visualisation look both visually pleasing while still being effective. I like to take on the bigger datasets to visualise – those that have a lot of diversity, so I can show context and other stories besides the main insight.
I’ve been freelancing under the name of Visual Cinnamon for almost three years. I work mostly on pieces that are used for marketing – either internally or externally – used for articles (in print or online), press releases or maybe even some data art for in the office.
How was it that you originally got into data visualisation?
Daily design news, reviews, how-tos and more, as picked by the editors.
My story starts with astronomy. I’ve always loved the topic and studied it full-time for five years at university. But I also knew the next academic step wouldn’t make me happy. So after I graduated in 2011, I decided to join the new analytics department of Deloitte Consulting.
The word ‘data scientist’ hadn’t even reached the Netherlands then, so I was a ‘consultant advanced analytics’. I was doing analyses on people and companies instead of stars. Different but still fun and a lot more diverse actually. Yet after about three years, I started to lose my passion for data analysis. I didn’t enjoy spending that extra hour making my predictive model just a tiny bit better.
During a data-science conference in 2014, I saw the speaker Mike Freeman calling himself a ‘data-visualisation specialist’ on the first slide. And then it hit me like lightning: ‘You can do data viz as a separate thing?!’
So what was it about data viz that struck such a chord?
It combined the maths/data/exact side that I enjoyed with the creative side that I’d also always had. So from that conference onwards, I started to dedicate all of my spare time to learning more about data viz: reading books to learn about the best practices as well as doing personal projects to get better with d3.js.
You went freelance in 2017. How has your career developed since then?
Going into freelancing is one of the best professional steps that I’ve ever taken; I’ve not regretted it for a single day. I’ve had the opportunity to work with clients I thought I could only dream about, such as Google, UNESCO and the New York Times. I’m also enjoying the wide breadth of clients and datasets I now get to work with, from small startups to big names and from magazines or non-profits to corporates.
I generally try to have three to four clients at the same time, so that I can switch between them throughout the week. I might be working on some science-related research, cultural heritage and what people search online for about cats and dogs, all in the same week. I’m still keeping my fingers crossed that maybe the WWF, Disney or NASA/ESA will come knocking on my door at some point.
What are your go-to tools?
I use R to do my data preparation and analysis at the start of a project. This helps me build a mental model of what the data is about, where the interesting aspects to visualise are and how to restructure the data in a way that I need for the visual.
I design using either plain pen and paper or with the Tayasui Sketches app on my iPad Pro and Apple Pencil, so the designs really stay rough. From there, I then go to Visual Studio Code to program my data visualisation with d3.js and JavaScript.
Depending on the amount of data to show or the complexity of interactions, I’ll create it with SVG for simpler things or HTML5 Canvas for larger visuals. On some rare occasions I might also create the visual with three.js if the data is really big.
Finally, if the finished piece is going to be a static image, I’ll export the visual I’ve made in JavaScript to Adobe Illustrator to add some final touches that are easier to do there than through code, such as a legend or annotations. That said, I’ve recently started to work with and enjoy Affinity Designer and might completely migrate to that for my vector work in future.
What are the biggest mistakes people tend to make when they are creating data visualisations?
Not taking the time to think about the visual form they’ll put their data into. I see a lot of people who think that any chart form will work just as well – bar chart, line chart – as long as the data is made visual. They just go straight from the data in a sheet to the ‘available chart list’.
However, getting the basic chart form right is actually the most important factor in determining whether the visual will be effective. So take some time to think about your goal. What does this visual need to teach people and what is the best way to convey this? Even sketching out some very rough possibilities and trying different chart forms can make all the difference.
What do you love most about your work and which parts are the least fun?
What I love most is the designing of the visual and creating the static part through code. To build up the idea with the actual data, start to experiment with design ideas and see it slowly come to life. The least fun part – aside from reading and creating contracts – is making the visual work on both mobile and desktop: there’s such a giant difference in space available to work with! It puts a no-fun constraint on my creativity.
I’m also quite bummed out when I need to compromise on a design idea I have because the browser can’t keep up in terms of performance. And don’t get me started on browser bugs…
What’s been your proudest career moment so far?
Winning Best Individual at the Information is Beautiful Awards in 2017. Getting that kind of recognition when there were so many amazing people to choose from just blew me away. I didn’t see it coming and went on stage at the ceremony totally unprepared, overwhelmed and exceptionally honoured. It really boosted my self-confidence, especially since starting out as a freelancer that year had been such a scary step.
How will data visualisation change over the next 10 years?
I truly have no idea but it’s certainly getting bigger. Companies seem to understand more and more that data visualisation is a good investment and that if you want it done well, you need to hire an expert. The number of people wanting to work in data viz is also growing exceptionally fast, perhaps even faster than demand.
So what would you like to see happen?
Maybe in 10 years someone will have figured out how to do good data viz through AR/VR. I also hope that the general audience will have gained better graphical literacy through regular exposure to data visualisation in the news, at work and at school.
A longer version of this article was originally published in issue 328 of net, the world's best-selling magazine for web designers and developers. Buy issue 328 or subscribe to net.
Join us in April with our lineup of JavaScript superstars including Nadieh Bremer at GenerateJS – the conference helping you build better JavaScript! Book before 5pm on 31 January to save £110 with Early Bird Tickets at generateconf.com
Read more:

Thank you for reading 5 articles this month* Join now for unlimited access
Enjoy your first month for just £1 / $1 / €1
*Read 5 free articles per month without a subscription
Join now for unlimited access
Try first month for just £1 / $1 / €1
Tom May is an award-winning journalist and author specialising in design, photography and technology. His latest book, The 50th Greatest Designers, was released in June 2025. He's also author of the Amazon #1 bestseller Great TED Talks: Creativity, published by Pavilion Books, Tom was previously editor of Professional Photography magazine, associate editor at Creative Bloq, and deputy editor at net magazine.
