11 JavaScript frameworks for creating graphics
Javascript frameworks to help you produce perfect animations, illustrations and data viz.
Sign up to Creative Bloq's daily newsletter, which brings you the latest news and inspiration from the worlds of art, design and technology.
You are now subscribed
Your newsletter sign-up was successful
Want to add more newsletters?

Five times a week
CreativeBloq
Sign up to Creative Bloq's daily newsletter, which brings you the latest news and inspiration from the worlds of art, design and technology.

Once a week
By Design
Sign up to Creative Bloq's daily newsletter, which brings you the latest news and inspiration from the worlds of art, design and technology.
Once a week
State of the Art
Sign up to Creative Bloq's daily newsletter, which brings you the latest news and inspiration from the worlds of art, design and technology.

Seasonal (around events)
Brand Impact Awards
Sign up to Creative Bloq's daily newsletter, which brings you the latest news and inspiration from the worlds of art, design and technology.
Javascript frameworks can fulfil a range of functions. Here, we're going to look at some libraries that will help you create stunning graphics.
The browser does offer several high-powered drawing APIs and surfaces. Most notable are the canvas element and scalable vector graphics (SVG). Both of these features are now available in almost all desktop and mobile browsers, but the APIs required to use them are rather low level and 'low level' typically translates into a lot of tedious and redundant code just to do simple things.
Since writing tedious and redundant code is not high on the list of things that developers typically enjoy doing, even with the best code editors and the best laptops for programming, there are thankfully several libraries available to help you with all of your browser drawing requirements.
In this article, we'll take a look at some of the options available. We'll explore the most popular JavaScript libraries and talk about their strengths and weaknesses. We're also going to do a little spelunking into some of the lesser-known projects that fill some very interesting niche needs – the kind that you don't know you need until you need them.
Also see our articles on the best JavaScript frameworks and JavaScript tools to try. Starting from scratch? Then try a top website builder, and consider which web hosting service is right for you. You might also want to see our selection of CSS and JavaScript tutorials.
01. D3.js
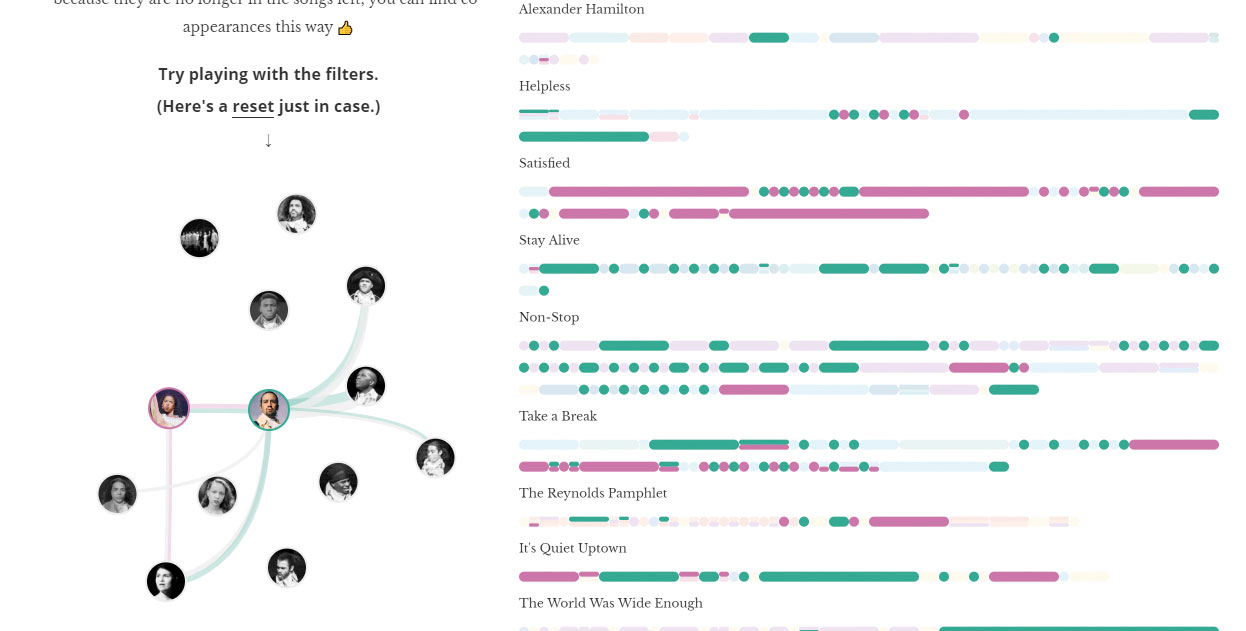
D3.js is the big boss of JavaScript graphics libraries. With over a million weekly downloads on npm, it is quite possibly the most well known and widely used of all the graphics libraries. It even has its own Wikipedia page. And, let's face it, isn't that when you know you've made it to the big time?
D3 enables you to build data visualisations of any kind. You only need to glance through its examples page to see the world of possibilities. Better yet, visit Shirley Wu's interactive visualisation of every line in the musical Hamilton if you really want to have your mind blown.
Sign up to Creative Bloq's daily newsletter, which brings you the latest news and inspiration from the worlds of art, design and technology.
D3 is an all-encompassing tool. It has its own DOM selection, AJAX capabilities and even a proprietary random number generator. Each component of D3 is its own Node module that must be imported. For instance, the selection module is called d3-selection. There are also modules for arrays, shapes, colours, drag-and-drop, time and much more.
The power of D3 comes with the trade-off of complexity. The learning curve can be steep and the code can still feel verbose. Building something as simple as a bar chart requires you to manually assemble the axis, scales, ticks and even draw the rectangles that will represent the bars. Developers often complain about the low-level understanding required to be effective with D3.
This is largely because creating complex data visualisations requires you to have a low-level understanding of the visualisation you want to create. D3 is not the best option for pre-baked charts. For that, there are several other choices that will find you in the 'pit of success' much faster.
D3 is capable of rendering to canvas and SVG. However, the real magic of D3 is in its ability to 'data bind' to the graphics it generates. Think of a chart that changes as the incoming data changes. With SVG, each graphical item is an individual element that can be selected and updated. This is not possible with canvas and, since D3 is fundamentally about powering data visualisations, SVG is usually the preferred output format.
02. Chart.js
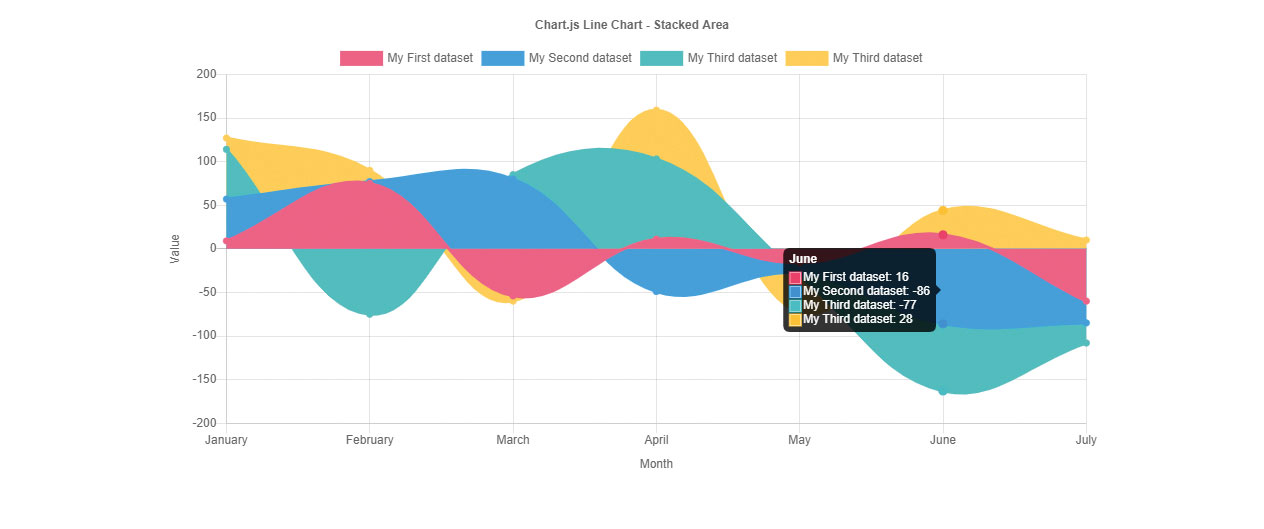
Chart.js is an open-source project for building robust charts with JavaScript. The big difference between Chart.js and D3 is that while you can build just about anything with D3, Chart.js limits you to eight pre-built chart types: line, bar, pie, polar, bubble, scatter, area and mixed. While this seems limiting, it's what makes Chart.js simpler to get started with. This is especially true for those who aren't experts in data vis but know their way around a basic chart.
The syntax is all built around a chart type. You initialise a new chart on an existing canvas element, set the chart type and then set the chart options. Chart.js only renders to canvas. This is not a problem since all modern browsers support the HTML canvas element but it might be a hangup for developers who have requirements for SVG support.
It also means you are limited in the animations that are possible. Out of the box, Chart.js has support for all easing equations and animations are specified with one property setting. While that makes it quick and easy to get an animated chart, not having individual SVG elements prevents you from being able to do complex animations using CSS3 transitions and animations.
Unlike D3, Chart.js is not modular, so it only takes one JavaScript include to get support for all functions and chart types. This makes it easier to get started but means your assets can be much larger. This is especially true if you require time axes – Chart.js then requires Moment.js, which is ~51kb minified and zipped. It's far easier to create a bar chart with Chart.js than with D3. However, there is a ceiling that comes with the simplicity. You may find you hit the limit of what it will do out of the box. Often, developers start with a solution like Chart.js and then graduate to D3.
If the simplicity of Chart.js appeals to you, you might really like the next option: Chartist.
03. Chartist
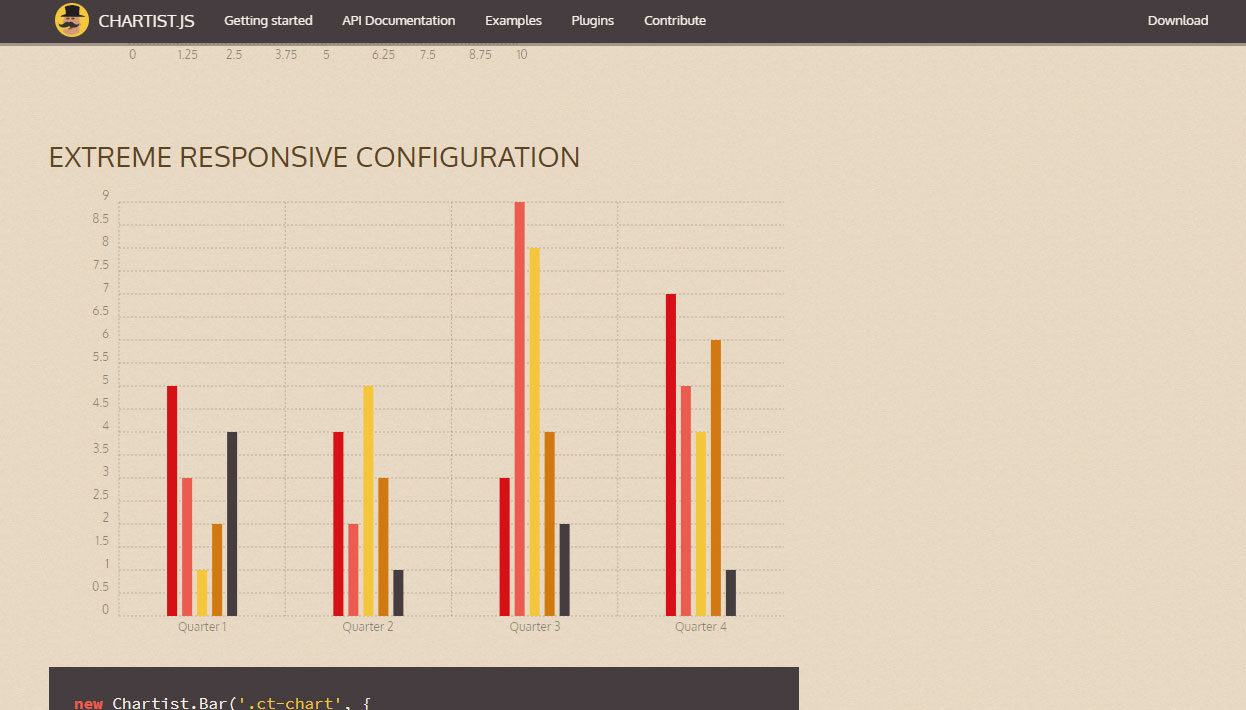
Chartist aims to be a simple, streamlined charting library that is small in size and easy to get started with. It is also designed to be responsive by default. This is a bigger deal than it sounds, as frameworks like D3 do not resize charts automatically but require the developer to tie into events and redraw graphics.
Chartist is also tiny in comparison to Chart.js. It weighs in at a mere 10KB with zero dependencies. That might be because it only offers three chart types: line, bar and pie. There are variations within these types (ie scatter plot is a line type in Chartist) but the tiny size and ease of configuration is countered by the lack of out-of-the-box chart types.
Chartist renders to SVG instead of canvas, making it much more customisable in terms of look and feel, as well as providing far more control over interactivity and animations. However, not having rendering access to a canvas means that you might have a harder time doing certain actions. For instance, there is an API for rendering a canvas to an image (toDataURI). That option does not exist for SVG, so exporting a chart as an image will prove to be much trickier. In an ideal world, you would have the option to render to both modes.
Chartist charts are easier to configure than Chart.js, as there are fewer options available. While it's possible to extend these charts with quite a bit of functionality, their focus on simplicity means that they are, by definition, simple. Chartist is a great solution for those who need a basic charting solution. Charts are inherently hard to configure as they require some sort of knowledge about how to set up the data along certain axis and grouped in certain ways. Chartist makes the charting portion as simple as possible but you may find yourself in need of a more powerful solution as you become more comfortable with generating your charts.
Chartist also lists open-source framework support, including React and Angular. There is no mention of a Vue package on its site.
04. Britecharts
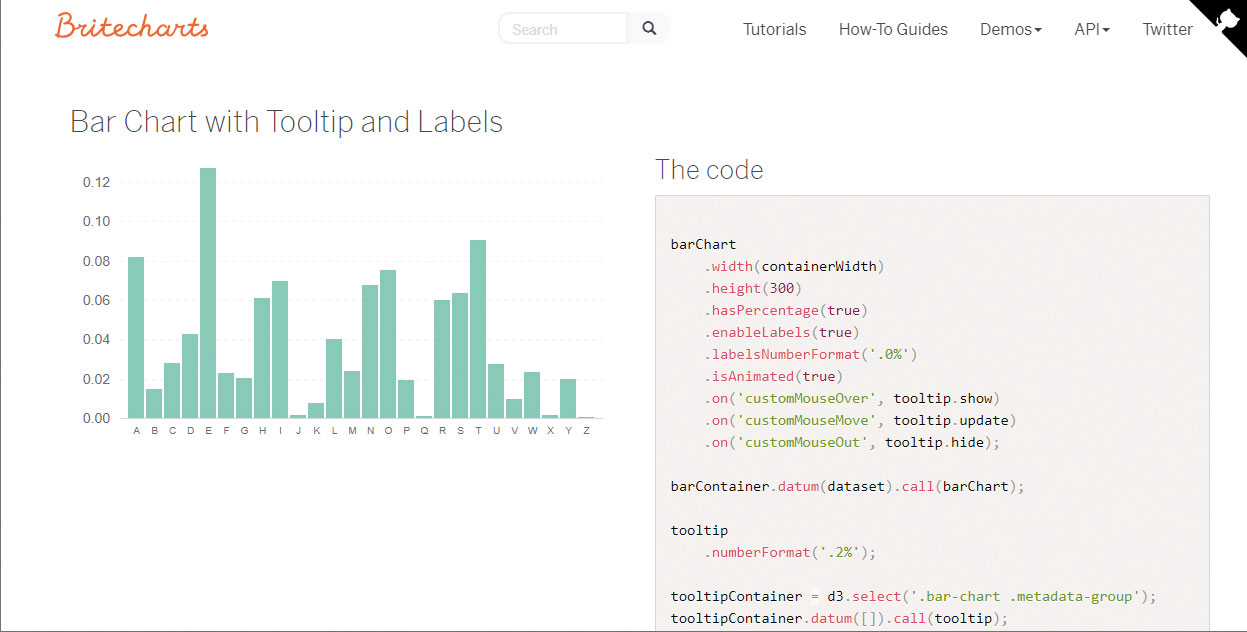
Britecharts is a charting library that wraps D3. It was made by Eventbrite, who then opensourced the project under the permissive Apache V2 license.
It offers a very minimal, yet aesthetically pleasing set of charts. While it can be quite a task to create a bar chart with vanilla D3, Britecharts' wrapping makes it as simple as creating a new barChart object and then setting its width and height.
barChart.width(500).height(500);Britecharts has support for all of the basic chart types: line, bar, donut, bullet, scatter plot, sparkline and step, which is more than those offered by libraries like Chartist. It also provides basic tooltip and legend functionality. The animations for the charts are built-in and Eventbrite has provided some beautiful colour schemes.
Ultimately, Britecharts is a great option for basic charting functionality. The configuration objects are quite simple and you still get the power of D3 under the covers without having to know anything about D3 itself. Many developers will find this a more compelling option than simply building a complete chart from the ground up with D3.
It also has a focus on the data-binding aspects of D3, making it quite good for charts that need to change as underlying data changes. While somewhat restrictive in the available types, it also has a base chart type that you can extend to create new chart types of your own.
05. Taucharts
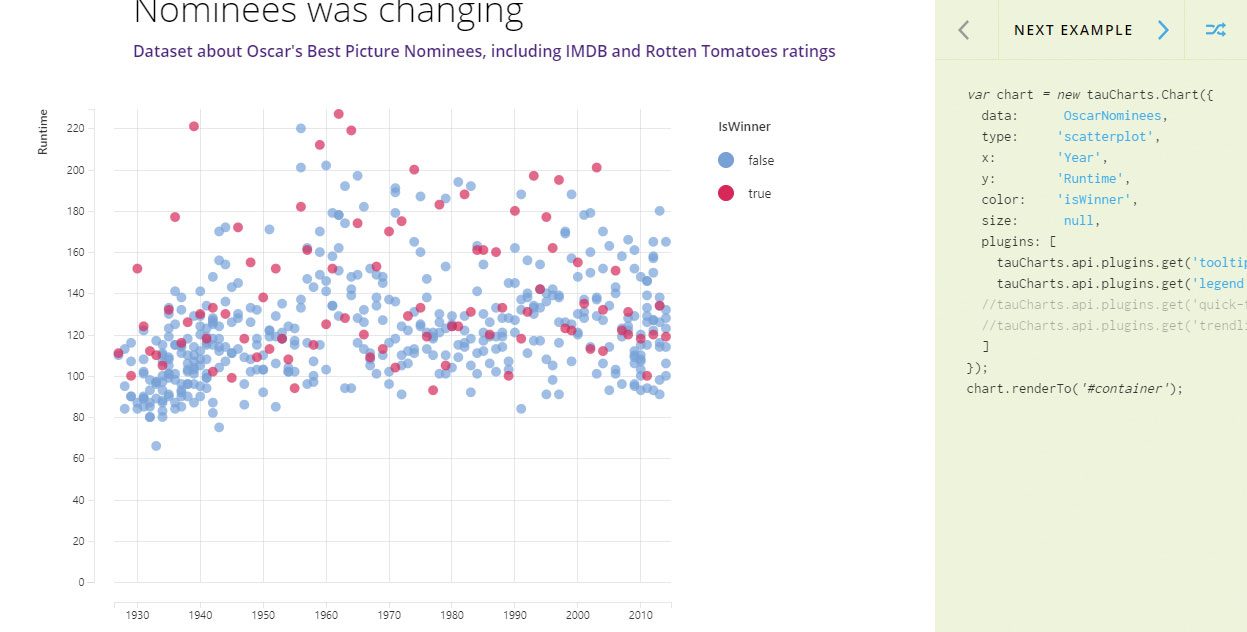
Taucharts is another charting solution that wraps the complexity of D3 in an easy to implement API. It is built on the concepts from The Grammar of Graphics, a book by author Leland Wilkinson. It provides understanding of when and how to use which data visualisations to display different kinds of data.
Out of the box, it features line, bar, scatterplot, area and facet charts. However, it implements the concepts from The Grammar of Graphics into 'Taucharts Language', which provides a framework in which to implement your own data visualisations.
Taucharts looks quite compelling and the fact that it's built on D3 makes it an attractive and powerful option. There is the feeling, though, that the developer also needs to read The Grammar of Graphics in order to fully leverage its power.
So far we've covered only charting and data visualisation. This is because drawing charts is the most common use-case for a graphics library in a browser. But it is by no means the only one. Another quite common scenario for graphics is, of course, animation.
06. Two.js
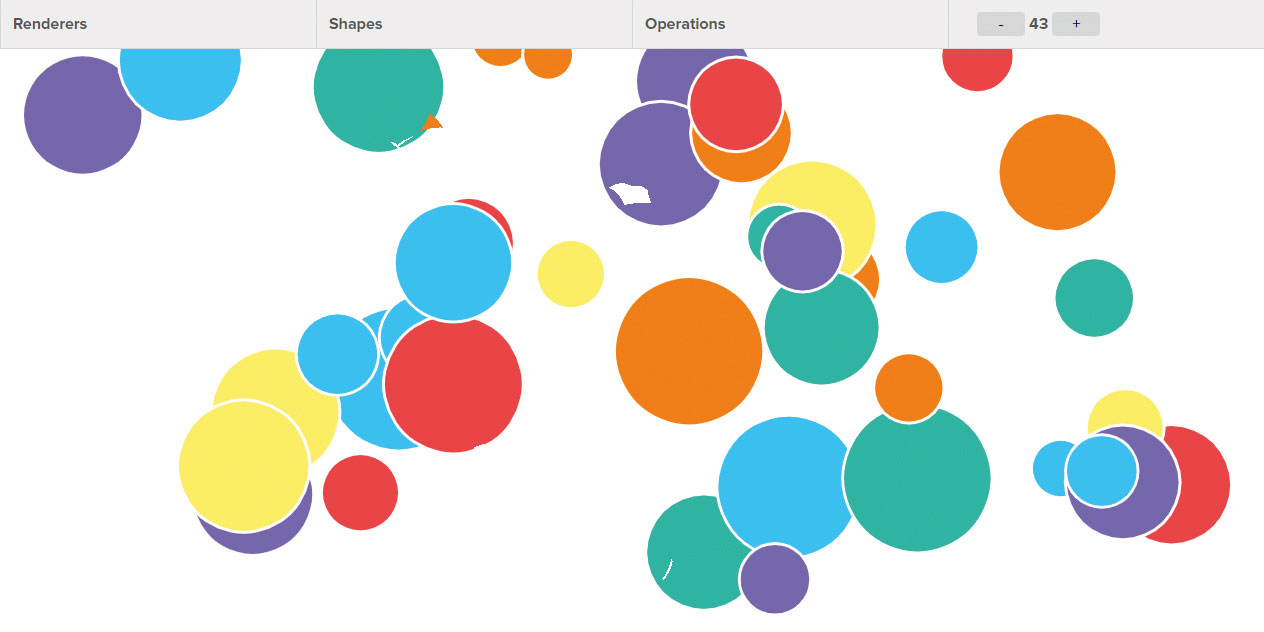
Not to be confused with D3.js, two.js is an open-source JavaScript library for two-dimensional drawing on the web. It is also able to target all three graphics options in modern browsers: SVG, Canvas and WebGL.
Two.js is somewhat similar to D3 in that it is strictly focused on drawing and does not have pre-baked charts or interactive structures to choose from. This means that, just like D3, you need an underlying understanding of the type of drawing you are trying to do and how to achieve that with the constructs two.js provides. Drawing a circle is rather straightforward. Building out a detailed animation, on the other hand, is a much more complicated endeavour. Two.js only abstracts the tedium of drawing shapes, not the tedium of the overall drawing.
Two.js also keeps track of all of the objects that you create, so you can reference and animate them at any time. This is particularly important if you are doing game development and you have assets that need to be tracked for things like collision detection. It has a built-in animation loop, which relieves you from having to worry about animation frames, and makes it easier to tie in an animation library such as GreenSock.
While two.js is powerful, its free-form nature might leave some developers unsure of how to begin and it's more of a niche tool for 2D drawing and animation. Another excellent option is pts.js.
07. Pts.js
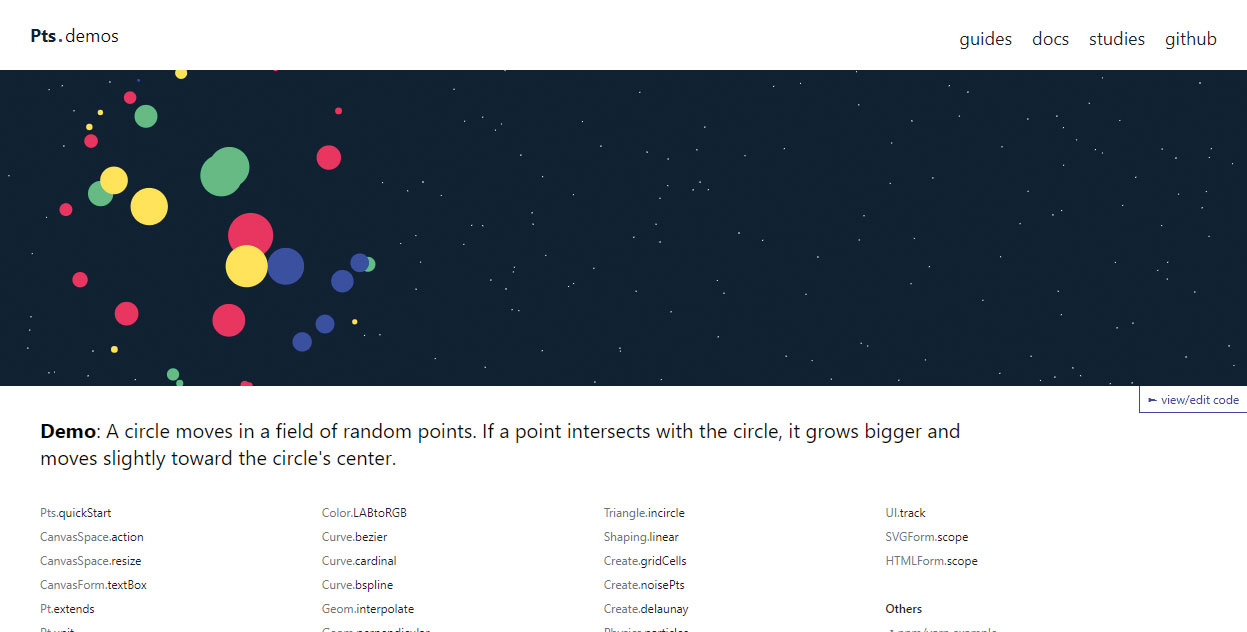
Pts is also a two-dimensional drawing library. It is fundamentally different to two.js however, as it uses a predetermined methodology for how drawings and animations should be assembled: space, form and point. The analogy its developers use to explain this is one from the physical world. Space is paper. Form is the pencil. And point is your idea.
In terms of its implementation, space is a canvas element. Once the canvas element is created, you can add players to it. These can be either functions or objects. These functions and objects must conform to the predetermined interface that a space has. Pts is built on TypeScript, so there's no need to guess at what those are as the tooling you use will likely suggest those with autocomplete.
For instance, a space has a start function that you can specify. This is code that is run when the space is ready. Within these functions, the drawing to the space occurs using the form object. Form objects can draw any sort of shape and the point is where these items are located in the space.
Pts seems to be primarily designed for creating interactive visualisations and animations. Its implementation is interesting, albeit quite abstract. Developers may have a hard time understanding the 'space, form, point' model that Pts requires. This is another mental hurdle that will have to be cleared in addition to that of simply drawing and animating shapes.
08. Anime.js
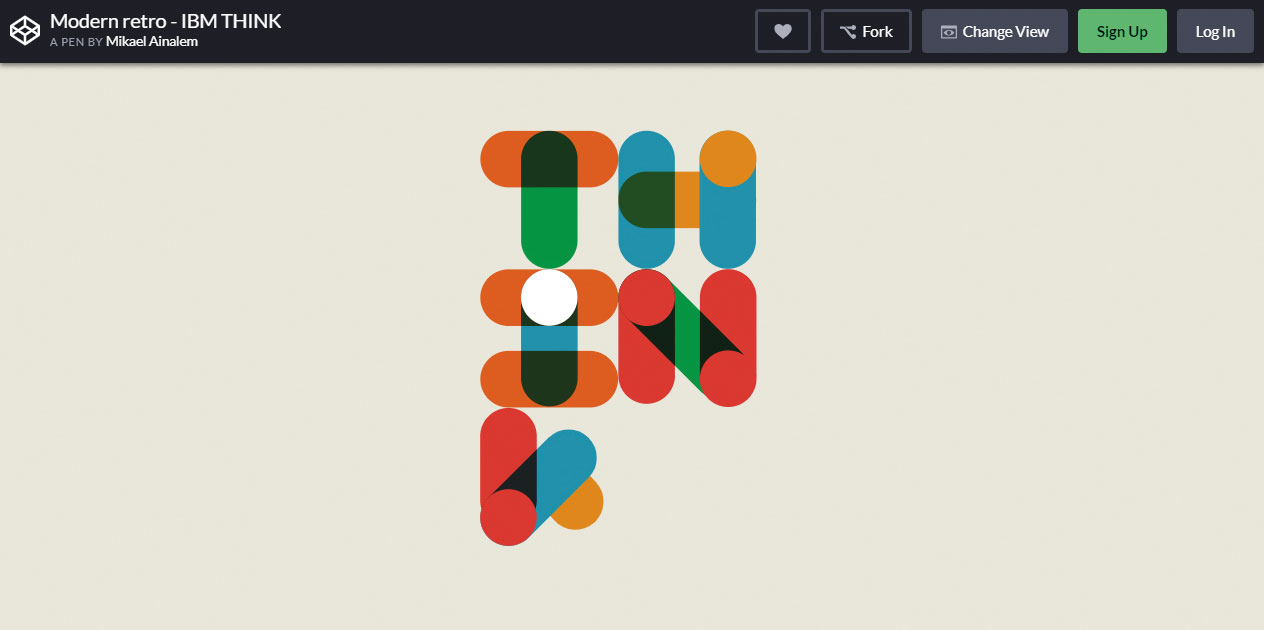
Anime.js is primarily an animation library. It has a built-in stagger system to make it more simple to have complex animations that overlap or are dependent upon the occurrence of another execution. It's common for animations to be timed together or to be triggered by one another. The staggering system makes this easier to implement, as it helps relieve some of the overhead of tracking everything happening on the page and manually configuring the animation timings.
Unlike the drawing libraries covered so far, anime.js doesn't have APIs for drawing shapes. Instead, it assumes your shapes already exist and that you want to animate them. This makes it great for use with libraries such as two.js. Anime.js has support for animating CSS properties, SVG, DOM and even JavaScript objects.
Anime.js is a good option for animating existing drawings and will likely be combined with another library. It should be considered an alternative to something like GreenSock and not a replacement for other drawing libraries. Anime.js would likely be used for more complex animations that need to happen as part of an interactive web experience.
09. PixiJS
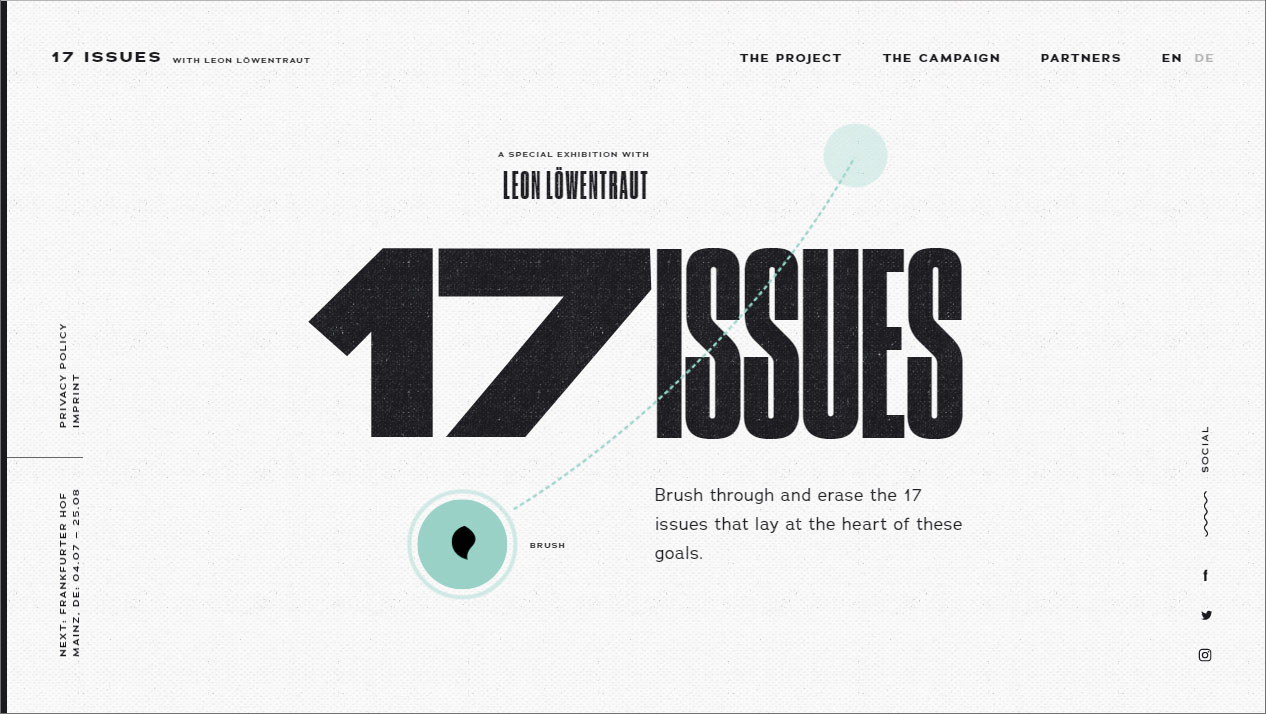
PixiJS is another 2D drawing library. Its main purpose is to make it easier to display, animate and manage 2D graphics, so you can focus on building your experience or game without worrying about keeping up with all of the shapes and images you have to draw and animate. If you're building a game, assets (or sprites) can quickly balloon to a number that's hard to manage. (Lots of assets to save? Keep them safe in the most reliable cloud storage.)
A compelling aspect of PixiJS is that it comes from an API that was built and used extensively in Adobe Flash. This is a huge benefit for developers coming from a Flash background, as the experience will feel familiar. It is also similar to Apple's SpriteKit.
PixiJS is not a game engine, so if you're using it for games, you won't find any tools or physics to handle things like collision detection. You'll need to wrap it in an actual game engine or one you build yourself, if you're feeling intrepid.
PixiJS renders to WebGL. WebGL is an engine for doing GPU-accelerated graphics in the browser. This means it is useful for animations and graphics that use a lot of system resources and would perform best when rendered by a discrete Graphics Processing Unit (GPU). It is based on OpenGL, which is the desktop equivalent for running games and 3D graphics programs. Underneath the hood, WebGL uses the HTML canvas element.
Serious graphics developers will appreciate the power of WebGL. However, these experiences may be degraded on lower-powered machines. Even as I was putting this article together, many of the PixiJS demos caused a noticeable slowdown in my system, which does not have the higher-end capabilities required for complex graphics and animations.
10. Zdog
Most of the drawing engines that we have discussed so far are two-dimensional. This is because most of the interacts we have with our screen occur in two dimensions – along the X and Y axis. Three dimensional drawings and animations are usually much more complex.
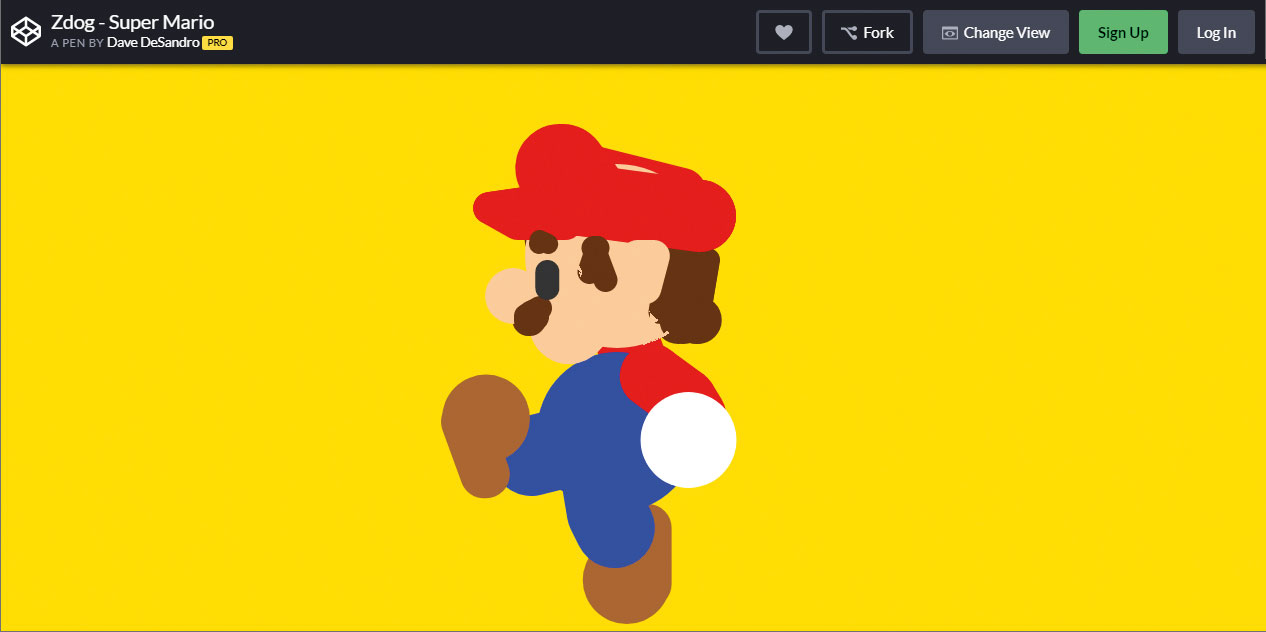
Zdog is a library for building pseudo- 3D experiences that are mostly flat in nature. It's called pseudo-3D because while it conceptualises its drawings in 3D space, it renders them as flat shapes. It uses visual tricks to make 2D objects appear 3D. The effect is really interesting. It looks completely three dimensional when the animation is viewed but when a screenshot is taken, it is clearly a flat image. Here is one example: the rotating Mario demo.
Since the renderings are 2D, Zdog can render to either Canvas or SVG. Zdog is a fantastic option for 3D animations on simple objects – especially if those assets incorporate aspects of flat design. Developers who want 3D animation but don't want to get bogged down in the complex world of 3D graphics engines might find Zdog an adequate solution. Additionally, with its focus on flat images, Zdog can afford a much simpler interface and much higher performance than would be required for the 3D rendering of complex graphical images.
It does not have the elements of a game engine such as asset management and collision detection, so would need to be wrapped in a game engine or those considerations taken care of manually. This means Zdog is probably best for isolated 3D animations on landing pages.
11. Snap.svg
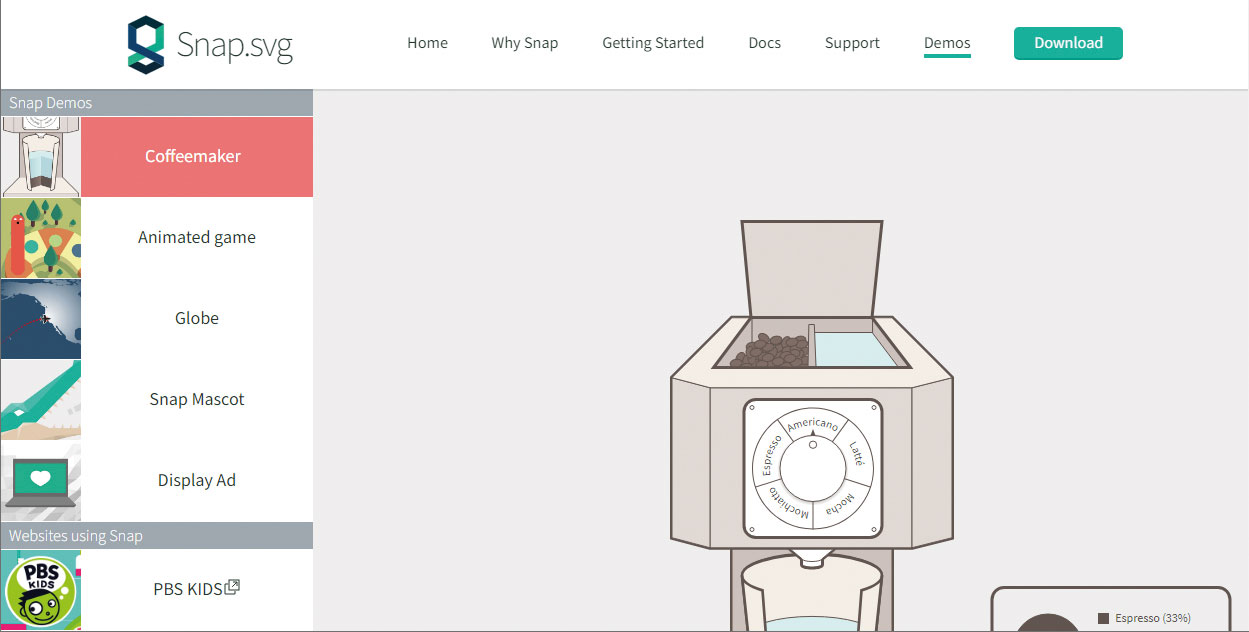
Snap.svg says it makes "working with your SVG assets as easy as jQuery makes working with the DOM". You might be able to tell from the jQuery reference that Snap.svg is a bit older but its API does feel as easy as jQuery and that is quite a powerful thing.
Snap.svg has a clean and simple API for selecting your main SVG element and then drawing elements to it. It is most suited to developers looking for a quick solution for animating SVGs. It is a particularly good option if your animations are simple and you don't have a lot of knowledge about animation engines. While it is somewhat dated, it certainly shouldn't be overlooked, as it could be the easiest way to work with your SVGs.
Snap.svg is refreshing in its simplicity. It's scoped to the job of selecting and working with SVGs and doesn't try to be more than that. Snap could be combined with other graphics libraries here for drawing and rendering to SVGs. It is also good if you have existing SVGs and you want an easy way to work with them.
This article was originally published in net magazine.
Related articles:
