How to improve the performance of ecommerce sites
Tammy Everts, director of research at SOASTA, explains how to optimise web performance and conversion rates.

Tammy Everts will give a presentation on the connection between design, performance and conversion rates at Generate New York on 28 April. Get your ticket today!
If you can't make it to New York, there's a related talk by web performance pioneer Steve Souders at Generate San Francisco on 9 June.
What tools do you recommend to analyse user data?
Ha! This is an easy question: I use mPulse, the real user monitoring and analytics solution developed here at SOASTA. Before I used mPulse, I used a combination of WebPagetest and Google Analytics. WebPagetest is one of the best free tools available for doing synthetic measurement of load times, start render times, and page size and composition. It’s still my go-to solution when I want to do some quick measurements of pages on sites that we don’t monitor at SOASTA.
I often get asked how mPulse is different from Google Analytics, because the two solutions seem superficially similar. In fact, most of our mPulse users also use Google Analytics, because the two tools are quite complementary.
Google Analytics helps you understand the effectiveness of your marketing, SEO, and advertising spend through general web analytics. SOASTA mPulse goes deeper and does things like show you which pages you should focus your optimisation efforts on in order to directly improve your business metrics, use predictive analytics to show you how much more revenue you could be generating if you make your pages incrementally faster, and give you better data to build smarter performance and load tests, so your site doesn’t collapse during a traffic spike.
How do you drill down into your data to focus on what you need to know?
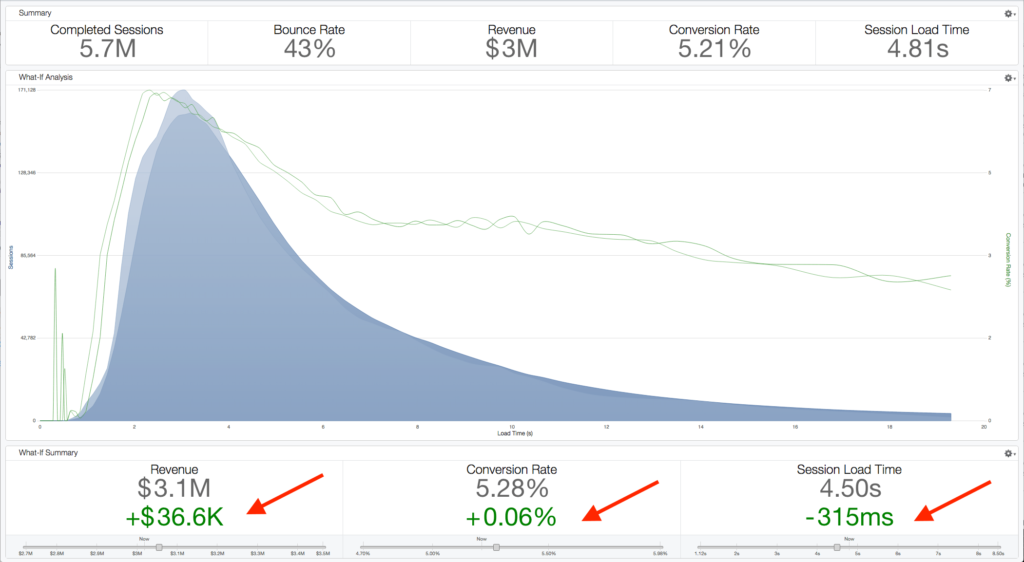
It depends on what I’m trying to understand. As I just mentioned, I use the mPulse dashboard to get realtime and historical insights into how the load times of pages affects metrics like bounce rate and session length. I can drill down in a bunch of directions from there using our deeper data science engine.
I use 'what-if analysis' – our predictive analytics feature – to understand how making pages faster and slower (in increments as small as 100 milliseconds) will affect bounce rate, conversion rate, and so on.
Daily design news, reviews, how-tos and more, as picked by the editors.
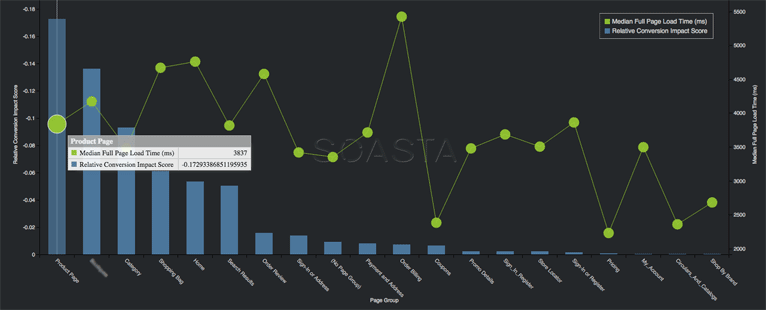
If I want to know which pages have the most impact on conversions in terms of their relative performance, I get Conversion Impact Scores for all the page groups on a site. Conversion Impact Scores answer the question: How much impact does the performance of this page have on conversions?
We realised we needed to create this metric because site owners were optimising pages they believed were important, but then weren’t seeing results when they looked at revenue and conversion numbers. Now we know that if you make certain page types faster, you see revenue and conversion improvements, whereas optimising other pages doesn’t make much difference.
When you know the scores for the different types of pages on your site, you can focus your optimisation efforts on those pages that are going to directly contribute to your bottom line. These are just a few examples. There are so many more.
How do you put this into action?
The great thing about this level of analysis is that the next steps become clear. Anyone with access to this data – and it’s extremely accessible throughout the organisation – can look at it and generate a punchlist of which page groups need to be fixed, and which defects need to be fixed on those pages. There’s no more guesswork. And you do this knowing that your efforts will pay off.
What are the three main things currently responsible for a slow website?
Images, third parties and scripts. Images make up two-thirds of the weight of the average page, and so many images are completely unoptimised. I see retail and media sites with literally hundreds of third-party tags, which can slow down or block your page from rendering completely. And there’s a lot of bad JavaScript out there.
Please give us three quick tips to optimise an ecommerce site in a day.
A designer/developer I know once told me that when she starts a new gig, the first thing she does is fix the low-hanging fruit, which immediately cuts load times in half. The result: she gets instant rockstar status – and more important, respect and credibility so that she can propose deeper optimisations.
Start with images. Are they in the right format? Are they the right size? Are they compressed? Are they context-sensitive, so you’re not loading 1000-pixel images onto someone’s phone?
Audit your third parties. Do you know what every third party script on your site is doing for you? Do you know if it’s slowing down your pages, and if so, by how much? Are you monitoring your third parties in real time, so you get alerts when a script is unresponsive? Do you have dead scripts on your page that don’t even need to be there any more? Have you considered using a tag manager, if you aren’t already?
Can you give us a few examples of how design factors can influence conversion rates?
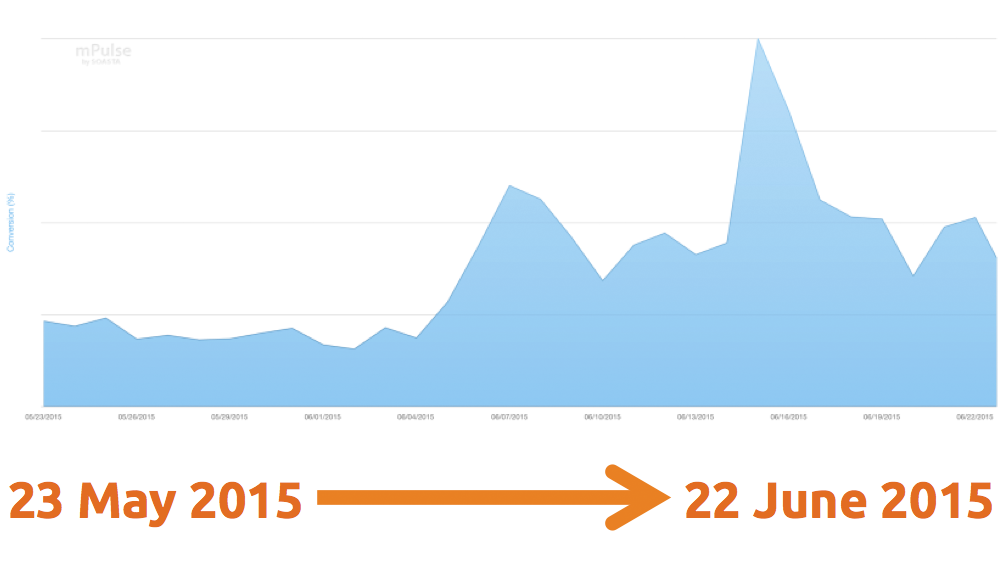
One of SOASTA’s customers, Fanatics, did a one-month optimisation sprint where two of the biggest changes they made to the frontend of the site were deceptively simple: they optimised image quality and compression, and they fixed an image sprite that was blocking page load. These changes contributed to a two-second improvement to their median load time and almost doubled mobile conversions.
Another SOASTA customer, Etsy, did an interesting little experiment where they added 160kb of hidden images to their mobile app, just to see what impact the added page weight would have on user behaviour. It triggered a 12 per cent increase in bounce rate.
How do you test the performance of ecommerce sites across browsers and devices?
This boils down to the testing and monitoring tools you use. A good digital performance platform will allow you to drill down into these different cohorts. It’s absolutely vital that you do this, because a site or app that’s extremely performant on one device or browser can utterly fail on another. And you won’t learn about it by looking at aggregated or high-level performance numbers.
I know it’s only March, but what can ecommerce store owners do now to prepare for this year’s Black Friday?
One thing online retailers can do now is to start developing better processes for creating, monitoring and optimising their marketing campaigns. I see so many email and promotional campaigns that direct shoppers to landing pages that are incredibly slow. In the rush to launch campaigns, retailers are serving their customers landing pages that take 10, 20, 30 or more seconds to load – and these load times are most assuredly hurting sales.
Running online promotions is potentially a great way to tap into your customer base – especially during the holidays – but this strategy comes with a new set of risks. It’s perilously easy to lose touch with how campaigns are performing. Slow landing pages are the weak spot in your campaigns. The load time 'sweet spot' for peak conversions is just 2.4 seconds. After that, every 100 milliseconds of slowdown has a measurable effect on conversions.
If your landing pages have performance issues, chances are those issues will pop up within minutes after you launch your campaigns – but you’ll only spot them if you’re watching and know what to look for. That's when you want to monitor performance, find and fix defects, optimise the page or the offer, and track how the campaign is meeting your conversion targets – in real time.
How do you use machine learning at SOASTA?
There’s a myth in the performance industry that you don’t need to collect 100 per cent of your user data. There’s another myth that you don’t need to keep it. That’s because, in the past, only about 5 per cent of the data that gets collected ever gets used in a meaningful way. At SOASTA, our strategy isn’t just to let companies collect and keep all their user data: it’s also to show them how to extract meaningful insights from the other 95 per cent of their data.
One of the primary use cases for machine learning is to create context. For example, our customers can use machine learning to do realtime campaign monitoring. One of the biggest problems retailers suffer from is seeing a large percentage of their marketing campaign fail at launch – and they don’t see this till it’s too late. The marketing analytics systems do not give you the information to determine that you just launched a $5 million email campaign and it’s failing. You get to find out tomorrow.
So before you start a new campaign, you use machine learning to study all of your historical traffic to establish what’s normal. Then you can plot, in real time, user behaviour juxtaposed with those tolerance bands. You fire alerts only when what happens with that metric, activity, or revenue achievement goes out of bounds. And you fix problems right away, when it matters.
That’s just one example. There are so many, and we’re still exploring the tip of the iceberg in terms of what’s possible.
What can people expect to take away from your talk at Generate New York?
Web performance is business performance. It’s become cliched to talk about breaking down siloes, but the cliche is still true. Developers, designers, UX people, marketers, business owners… we all need to get outside our bubbles and understand that every decision we make about how we build sites and apps has a direct connection to business outcomes.
Luckily, we have rapidly evolving sets of tools and metrics that can give us a 360-degree view of performance. I want people to see how empowering these tools and metrics can be.
What’s the last thing you bought online and what was the experience like?
I bought some kids clothes from the Gap, and the entire experience – from using the site to receiving my order – was so fast!
I was so happy at the end of the transaction that I even filled out their online survey… which illustrates why, as a retailer, you should take your online survey results with a grain of salt when it comes to understanding your customers. The people who fill them out are either really happy or really frustrated. They don’t represent the huge cohort of people in between. Surveys are interesting, but they’re no substitute for real user data.
Generate New York on 28 April features 14 talks by the likes of Sara Soueidan, Steve Fisher, Mina Markham, Abby Covert and Jennifer Brook. They will cover design systems, user research, information architecture, conversational interfaces, and much more.
The conference will be preceded by a day of workshops on usability testing, frontend tooling, information architecture and design and content sprints. If you buy a combined workshop and conference pass, you will save $125! But hurry, there are only limited places for the workshops.
If you can't make it to the NYC conference, there's also one in San Francisco on 9 June. Tickets are on sale now.

Oliver is an independent editor, content consultant and founder of Pixel Pioneers. Formerly the editor of net magazine, he has been involved with the web design and development industry for more than a decade and helps businesses across the world create content that connects with their customers. He is passionate about content, user experience, accessibility and designing for social good.


