Typography meets data in this amazing free font
Datalegreya lets you beef up your text with line graphs without the need for any extra software.

If words are never quite enough for you, here's a great new free font that can add a little more meaning to your text.
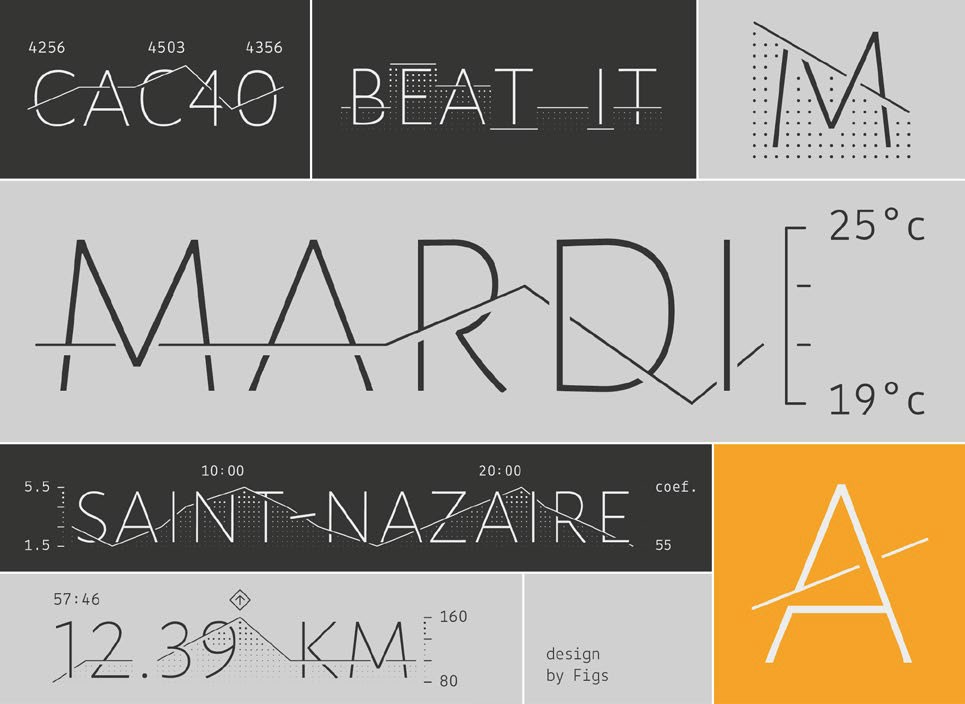
Datalagreya is a clever OpenType font that enables you to weave data curves through your text. Made with small screens in mind - the sort you'd find on wearables and connected devices - it's designed to enable you to effectively display graphical data such as annual reports, stock prices and weather data in contexts where there isn't much space to play with.

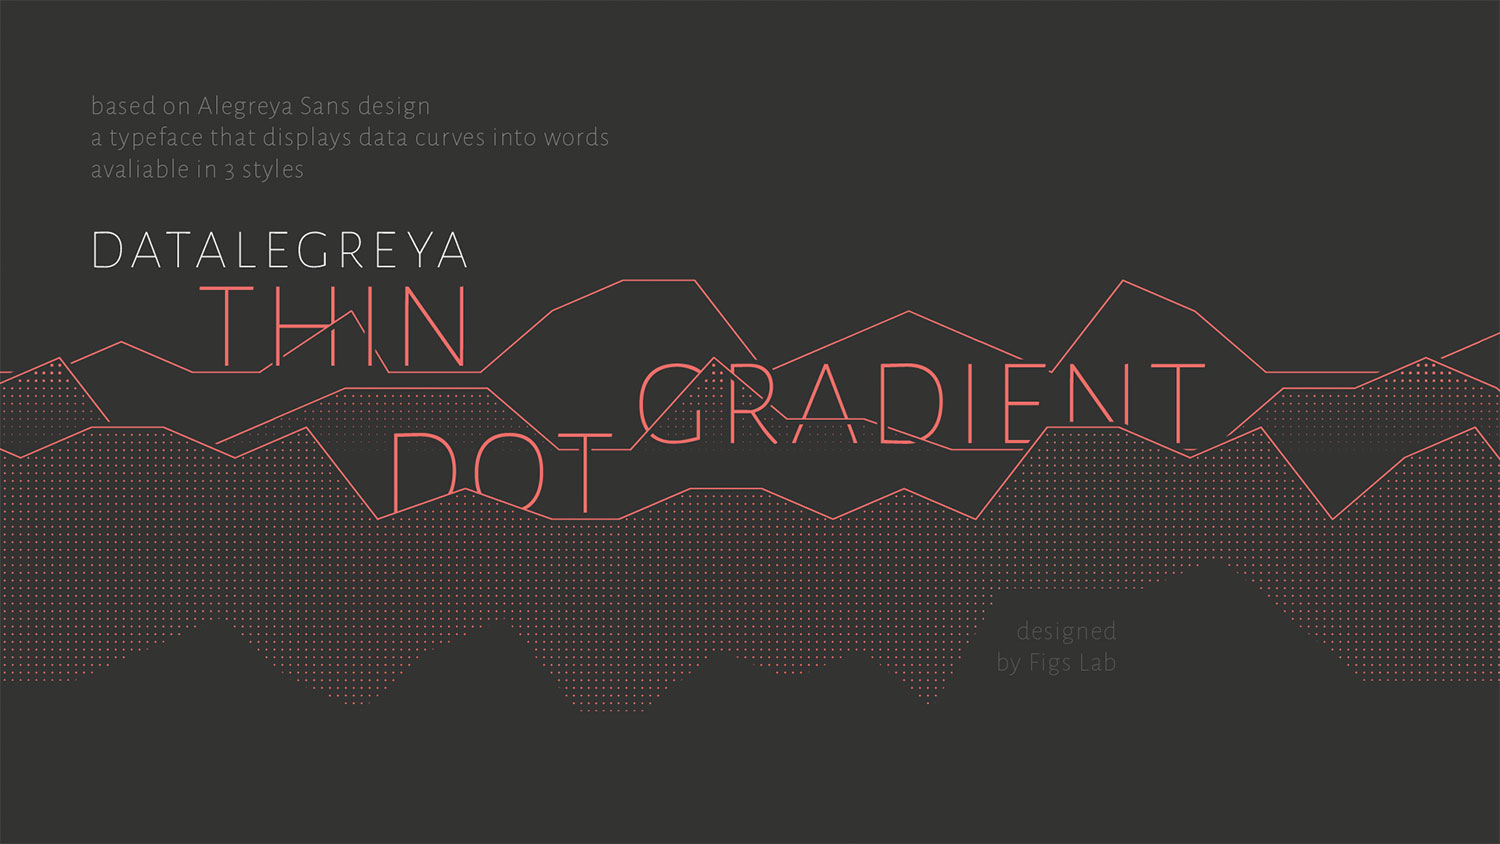
Built on top of Alegreya Sans SC Thin, an open source font by type designer Juan Pablo Del Perla, Datalegreya allows you to create some surprisingly sophisticated effects without the need for any additional software.
It'll display your data as a plain line, or you can fill it with a gradient or a simple dot pattern. And if you want to add a little more context to your data, through clever use of ligatures, contextual alternates and its own kerning table, you can add legends and other information to both the X and Y axis of your little graph.

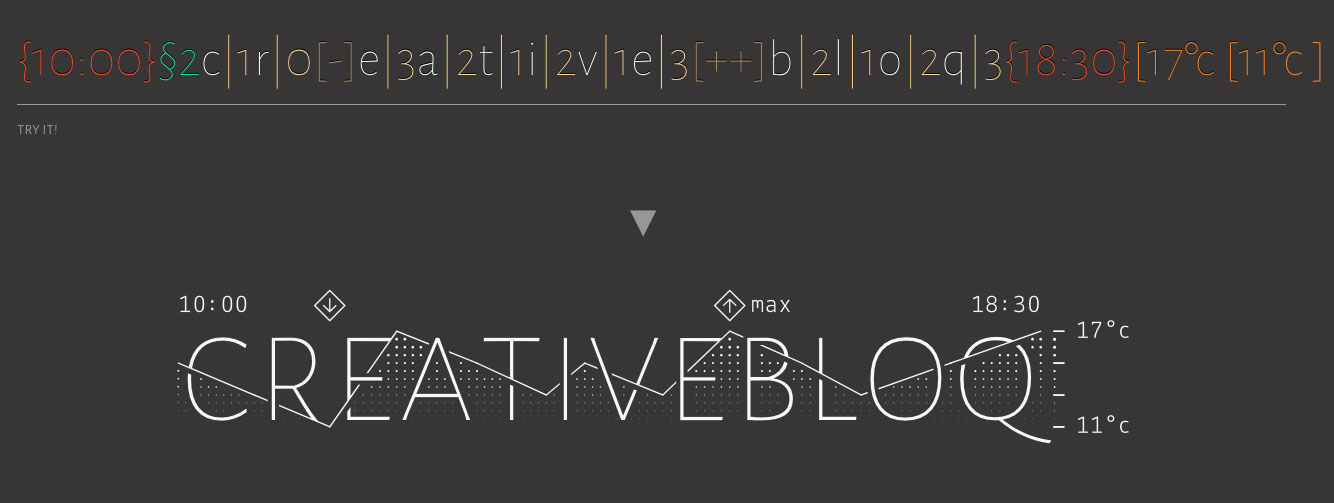
What's the secret? After each letter of the text you want to use in Datalegreya, you then enter a special character followed by a number, and the font automatically creates a data curve from the these numbers.
It's a little unintuitive at first, but once you get a feel for its ways it's surprisingly powerful; this page lets you play with the font and see how everything fits together.

Datalegreya is fully compatible with any app that works with OpenType fonts, and it'll work equally well on the web. It's the work of Figs, a French digital design workshop that specialises in user experience design and bespoke user interfaces. It's put together a useful guide to getting great results out of Datalegreya; find it here.
Daily design news, reviews, how-tos and more, as picked by the editors.
Related articles

Jim McCauley is a writer, performer and cat-wrangler who started writing professionally way back in 1995 on PC Format magazine, and has been covering technology-related subjects ever since, whether it's hardware, software or videogames. A chance call in 2005 led to Jim taking charge of Computer Arts' website and developing an interest in the world of graphic design, and eventually led to a move over to the freshly-launched Creative Bloq in 2012. Jim now works as a freelance writer for sites including Creative Bloq, T3 and PetsRadar, specialising in design, technology, wellness and cats, while doing the occasional pantomime and street performance in Bath and designing posters for a local drama group on the side.
