A guide to Google's web tools
In the good old days, developers debugged by emitting messages to the command line. The introduction of dedicated debuggers accelerated the error-finding process.
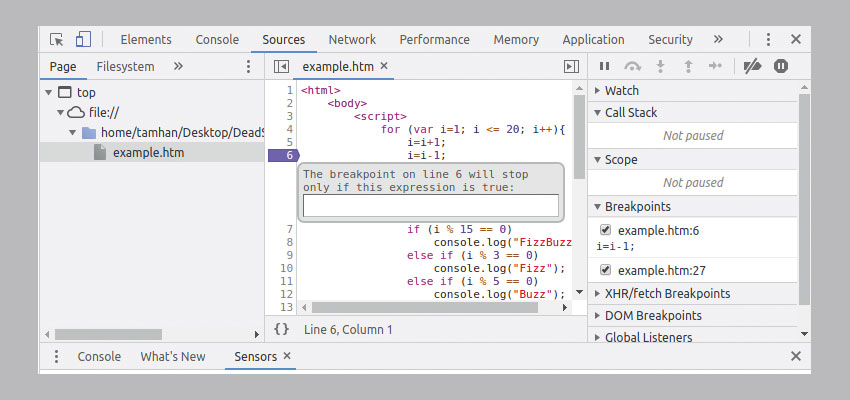
Debugger work centres around breakpoints. They act as an entry point into the debugging session – if code hits them, its execution pauses. The easiest way to add a breakpoint involves the Sources tab, where you click the margin to add a blue rhomboid.

When the relevant line is hit, a yellow insert pops up over the rendered view. Furthermore, the debugger window populates with various bits of information about the current ‘context’. Moving your mouse over any variable opens a pop-up window similar to the one shown in the figure. If the element in question is an object, a tree view will appear instead. It enables you to drill down into the individual variables.
Article continues belowGlobal variables show up in the Scope node. Click it and be prepared to wait for a second or two. Its population cannot be accomplished instantaneously due to the number of elements, using the Filter textbox at the top of the screen is highly recommended for usability.
As populating the entire state tree is slow, some fields get shown as (…) instead. Double-click any one of these attributes to load its value on the fly. Finally, use the call tree to find out where you are. It lists the methods called to arrive at the execution position.
Advanced execution
Placing breakpoints all over the place is inefficient. Analyse the flow of a variable by clicking the three step-over buttons next to the blue Play button. They enable you to run a single line or return from a function while keeping the debugger active during the process. This is helpful when hunting down value changes as an algorithm does its work.
Sign up to Creative Bloq's daily newsletter, which brings you the latest news and inspiration from the worlds of art, design and technology.
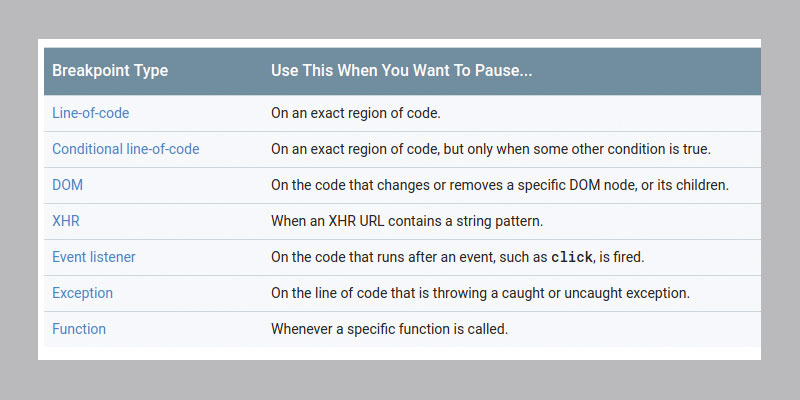
Another neat trick involves the use of conditional breakpoints. Chrome supports half a dozen of them, the table below describes them.

Setting these is done outside of the debugger. In the case of the DOM tree, for example, a node must be selected in the Element view. You can then specify that a debugging session must launch whenever the content of this node changes.

Just like with modern oscilloscopes, providing an overview of all trigger modes would require a book of its own. Let us, thus, end this little trip with a reference to developers.google.com/web/tools/chrome-devtools/javascript/breakpoints – it provides an excellent overview of the possibilities.
Resources
14 JavaScript debugging tips you probably didn't know
Finding errors in code is both an art and a science. The folks at RayGun have compiled a set of methods, tools and approaches intended to help you find hard-to-track issues in JavaScript applications. Create scrollable elements which have defined regions that should snap into view. Those larger than the viewport are handled automatically.
Debugging javascript cheat card
Like most other scientific endeavours, a few ‘best practices’ have arisen over time. The reference card from dzone.com might have an extremely annoying layout, but it does provide an overview of interesting aspects.
Chrome DevTools reference
Chrome’s debugger contains dozens of additional features that we don’t have room to cover in this tutorial. Seasoned web developers are advised to take a look at Google’s official documentation – some of the functionality tends to be a real timesaver.
WebStorm
Sometimes, Chrome’s developer tools simply don’t offer what you might be looking for. If that is the case, you can give a dedicated product like WebStorm a chance. Its debuggers tend to analyse the entire project structure, leading to even more advanced analytical capabilities.
Be sure to save useful resources in decent cloud storage, so you can access it later.
Next page: Working with Device Mode
Current page: Using debugger
Prev Page View and change HTML, CSS & JS Next Page Working with Device Mode
Tam Hanna is a software consultant who specialises in the management of carrier and device manufacturer relationships, mobile application distribution and development, design and prototyping of process computers and sensors. He was a regular contributor to Web Designer magazine in previous years, and now occupies his time as the owner of Tamoggemon Software and Computer Software.
