A guide to Google's web tools

Big G, aka Google, provides developers a plethora of tools intended to make web design easy. In this article, we go through some of the best Google tools out there, and show you how to use them in your web design and development workflow.
We're covering a range of different web design tools here, so we've split the content into pages to make it easier to navigate. Use the dropdown menu above to jump to the section you're interested in. Want to design a site using a different provider? Our guides to web hosting and the top website builder have you covered.
As long as websites are unminified, their content can be viewed by anyone. Chrome’s DevTools make this simple – on this page, we show you how to view and change HTML, CSS and JavaScript. On page 2, we take a closer look at how to use Google's debugger to fix coding errors quickly and easily. Page 3 puts the spotlight on Google's Device Mode, which you can use to test the mobile versions of your pages via your desktop machine. On page 4 we introduce the basics you need to be aware to start implementing Material Design principles in your designs. Finally, page 5 looks at Progressive Web Apps, the latest big thing in the web design industry.
View and change HTML, CSS & JS
As long as a website's code hasn't been minified, it can be viewed by anyone using Chrome’s developer tools. First of all, check the version of Chrome – the following steps work on version 70.0.3538.67 running on a 64-bit Ubuntu workstation. Next, open the hamburger menu and click More Tools > Developer Tools.
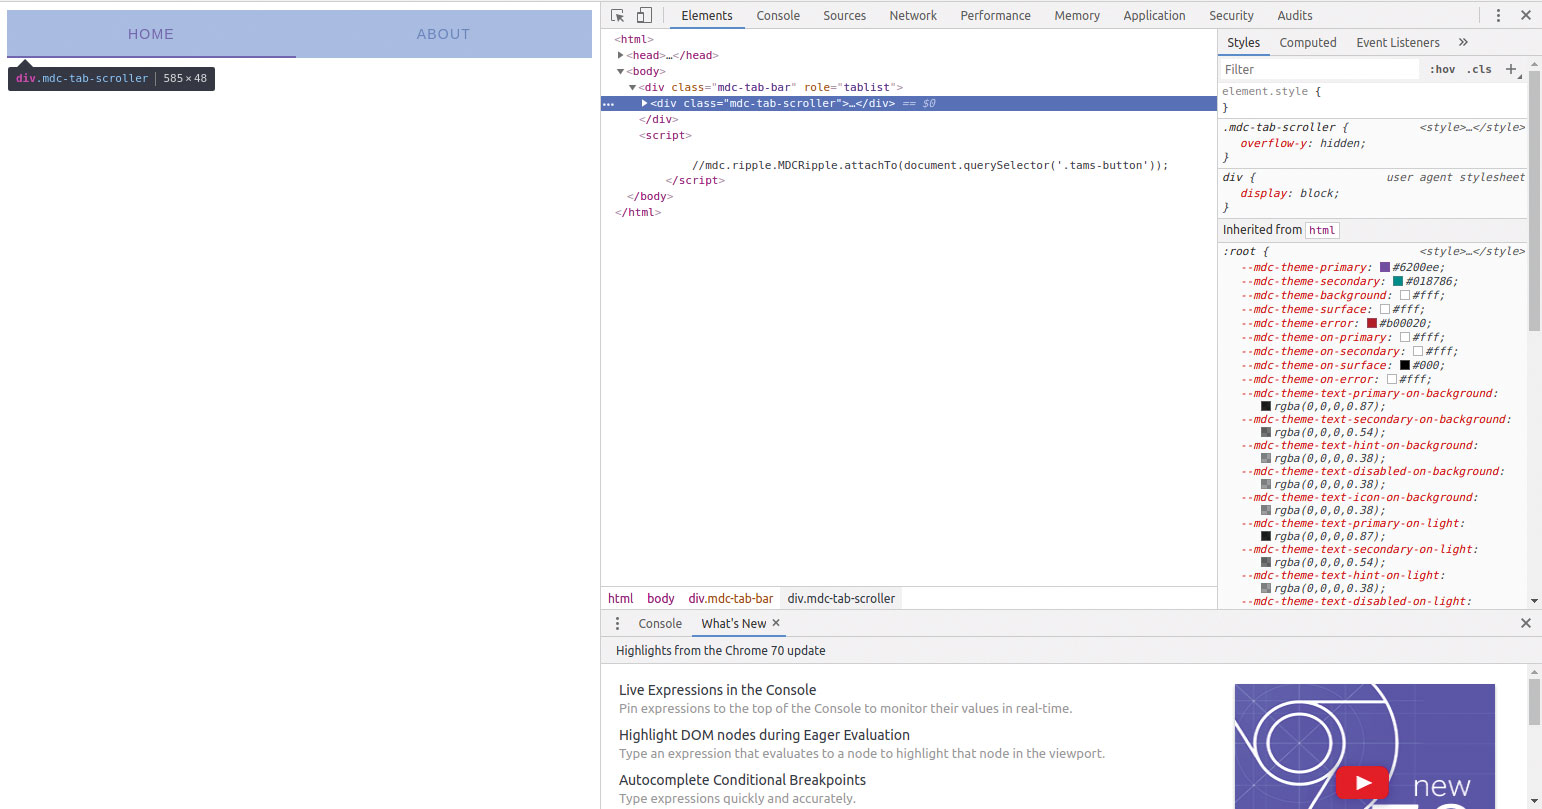
The browser responds by opening a pane on the left-hand side of your screen. It should be resized in the first step – by default, the browser doesn’t assign enough screen real estate. When done, the screen looks similar to the one shown in the image above.
By default, Developer Tools starts up with the Console tab loaded. It contains the output emitted by invocations of the console-logging function. Rendering errors also show up there – if you find red lines, something is amiss in the markup or the code of your page. A click on the little ‘URL’ on the right-hand side brings you to the line, which caused the message to show up.
Inspect the markup
If your interest focuses on markup, use the Elements tab shown in the figure. It shows the markup the browser currently renders. You can expand and compact it in a fashion similar to a tree view – hide unneeded elements to prevent sensory overload.
Sign up to Creative Bloq's daily newsletter, which brings you the latest news and inspiration from the worlds of art, design and technology.
The raison d’etre of the tab is the display of the CSS structure. Widgets ‘collect’ CSS from various sources, which are displayed neatly and next to one another. In the case of the example shown in the figure, we see that styles were provided from both the ‘div’ tag and the ‘main’ markup of the page.
Chrome lets you edit most attributes on the fly. Double-click any of the black texts to transform the label into an editor, then enter the newly desired value and press the Return key. The renderer picks up these changes and applies them to the DOM on the fly. This is especially useful when trying to optimise colours or placement issues; having to reload a page to preview changes becomes tiresome.
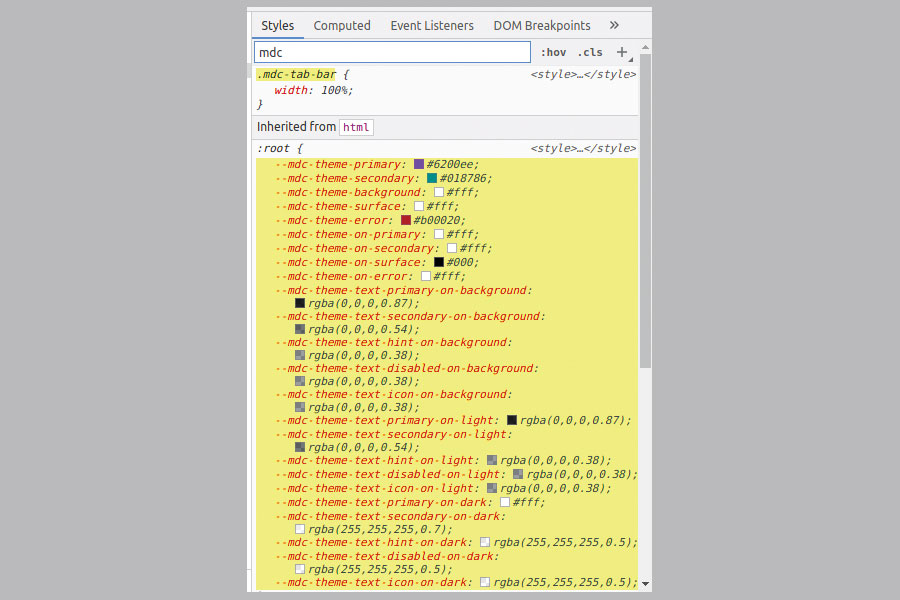
Finally, take a look at the text box on top of the pane. It enables you to filter the markup items shown: for example, enter ‘mdc’ to limit the view to all styles inherited from the Material Design library used later in this article. When a filter is active, a yellow background shows up in a fashion similar to the one shown above.
Perform a detailed analysis
In modern web browsers, the DOM is not limited to ‘statical’ presentation issues. It also governs event flow and placement. Switch to the Computed tab to reveal a list of ‘dimensional’ properties. This is incredibly useful when arranging widgets on the screen in an exact fashion.
Moving to the Event Listeners tab provides an overview of event flows. Use this feature to quickly weed out problems related to user interaction: if an event does not trigger, start out by checking the event handler connections.
Finally, the Properties window lets you take a look at the attributes stored inside the individual DOM nodes. If you’ve ever spent a lot of time hunting down DOM-manipulating code, the value is clear.
Next page: How to use Google's Debugger

Tam Hanna is a software consultant who specialises in the management of carrier and device manufacturer relationships, mobile application distribution and development, design and prototyping of process computers and sensors. He was a regular contributor to Web Designer magazine in previous years, and now occupies his time as the owner of Tamoggemon Software and Computer Software.


