How to create data visualizations with D3
Tim Ruffles shows you how you can use D3 to wrangle complex sets of data into beautiful, clean visualizations.
Daily design news, reviews, how-tos and more, as picked by the editors.
You are now subscribed
Your newsletter sign-up was successful
Want to add more newsletters?

Five times a week
CreativeBloq
Your daily dose of creative inspiration: unmissable art, design and tech news, reviews, expert commentary and buying advice.

Once a week
By Design
The design newsletter from Creative Bloq, bringing you the latest news and inspiration from the worlds of graphic design, branding, typography and more.

Once a week
State of the Art
Our digital art newsletter is your go-to source for the latest news, trends, and inspiration from the worlds of art, illustration, 3D modelling, game design, animation, and beyond.

Seasonal (around events)
Brand Impact Awards
Make an impression. Sign up to learn more about this prestigious award scheme, which celebrates the best of branding.

D3 is a toolkit for building data visualizations from scratch. It's a thin wrapper around the DOM, so with HTML, CSS and JavaScript you're already halfway there. It's tremendously powerful, and more than anything it's tremendous fun. Never again will you disappoint your designer by stuffing their expertly tuned Dribbble-fodder into a boring chart.
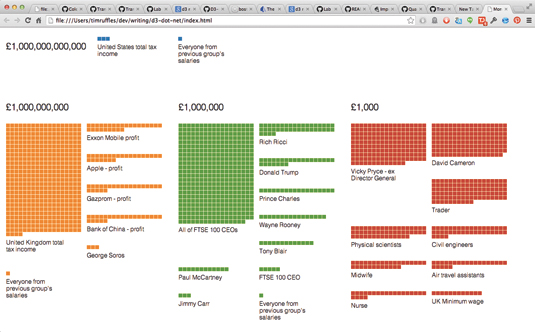
D3 is best taught by example, so we'll recreate xkcd's 'Money' visualization. We'll take take data on the income of people, firms and countries, and visualise them in broad groups of magnitude. D3 enables us to include very different incomes in the same visualization.
All the files you need for this tutorial can be downloaded from here.
Giving ugly code a makeover
Our task is split between data and presentation. A common source of ugly D3 code is not getting your data in the right shape. If you try to visualise your data before you've wrangled it into the right shape you'll end up with a mess.
We'll wrap up the data part in what D3 calls a 'layout'. Layouts sound visual, but are actually the data-wrangling side of a given visualization. They're standard JavaScript functions called with input data and returning new data formatted for display. A histogram layout might be passed an array of 1,500 objects, and return 10 arrays, each bucketing 150 objects. Displaying its output is entirely up to you. This splits the reusable data-processing algorithm from a specific presentation.
We need to break the incomes down into magnitude groups, and then visualise them as blocks. Our income data is in the format { value: 2500000, title: "Jimmy Carr" } our target format is below. It reflects the visualization: the previous group is included in the next for comparison, and we've calculated the number of unit blocks to display.
[
  {
    key: "1000000",
    total: 2124000000000,
    values: [
      { title: "Jimmy Carr",
        value: 2500000,
        units: 25 }, /* ... more salaries */
      { fromLast: true,
        value:  105000,
        units: 1 }, /* total of previous group */
    ]
  },  /* ... more groups of salaries */
];
Implementation
Let's implement! Our data is hierarchical so d3.nest() is the right tool: it takes an array and groups it by a key function.
Daily design news, reviews, how-tos and more, as picked by the editors.
function blockLayout() {

  var grouper = Math.log;
  layout.group = function(x) { grouper = x; return this; };
  return layout;

  function layout(data) {

    data.sort(function(a,b) { return b.value – a.value; });

    var nested = d3.nest()
      .key(function(d) { return grouper(d.value) })
      .entries(data)
      .map(function(group) {
        group.values.forEach(function(v) {
          v.units = getUnits(v.value,group);
        });
        group.total = group.values.reduce(sumValues,0);
        return group;
      });

    d3.pairs(nested).forEach(function(pair) {
      var group = pair[0], total = pair[1].total;
      group.values.push({
        value: total,
        group: group,
        fromLast: true,
        units: getUnits(total,group)
      });
    });
    return nested;
  }

  function getUnits(value,group) {
    return Math.ceil(value/parseInt(group.key));
  }
  function sumValues(a,s) { return a + s.value; }
}
As layouts are just JavaScript functions, and functions are objects, we expose our configuration function as the layout's group property. To configure our layout, we call .group(keyFunction) on the layout in a chaining style. To use it, we call it on our original dataset to create salaryGroups ready for binding.
var layout = blockLayout()
  .group(function(value) {
    if(value < 1e6)  return 1000;
    if(value < 1e9)  return 1e6;
    if(value < 1e12) return 1e9;
    return 1e12;
  });

var salaryGroups = layout(listOfSalaries);
Visualising

At this point we've not actually displayed anything on screen. This division of labour allows our layout to be reused with different data sets, key functions and final visualizations. Now we've cleaned up our data, we can visualise.
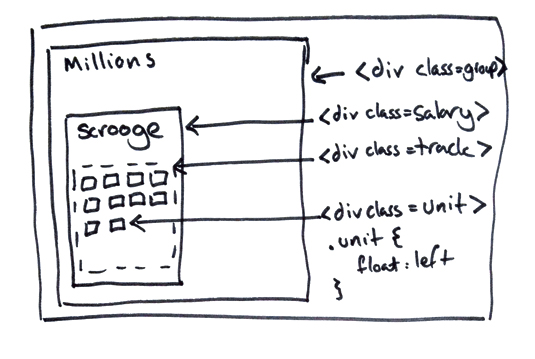
Here's a sketch of the HTML/CSS implementation - we append the top level groups to represent the salaryGroups from our layout:
var groups = d3.select("#viz").selectAll(".group")
  .data(salaryGroups)

var groupsEntering = groups.enter()
  .append("div").attr("class","group")
Next we present the individual salary elements. Our data is nested: we've appended elements for the top level group data which has the shape { key: "1000", values: [/* salaries */] } . We therefore make a selection of .salary elements inside each group, and pass a function pulling out .values to data() to dig down the hierarchy for the salaries:
var salaries = groups.selectAll(".salary")
  .data(function(x) { return x.values; });

var salariesEntering = salaries.enter()
  .append("div").attr("class","salary");
Finally we need to consider our units. We create track elements per salary, then use our nested data() trick again to make many units from each salary.
var units = salariesEntering
  .append("div").attr("class","track")
  .selectAll(".unit").data(createBlocks)
  .enter()
  .append("div").attr("class","unit")
createBlocks() is simple: if a salary needs 10 unit blocks, return an array of length 10:
[//]: # article-code.js:7
function createBlocks(salary) {
   var blockCount = salary.units, blocks = [];
   while(blockCount--) blocks.push(salary);
   return blocks;
}
It's easier to define all static styling via CSS. We want the units to flow inside a constrained track. The rest of the styling I'll leave to you.
.unit {
  float: left;
  width: 10px; height: 10px;
  background: red; }
.track {
  overflow: auto;
width: 200px; }
With a little more styling and titles added we're done. Now get out there and visualise!
Words: Tim Ruffles
Time Ruffles is an expert in JavaScript and a trainer. This article originally appeared in net magazine issue 257.

The Creative Bloq team is made up of a group of art and design enthusiasts, and has changed and evolved since Creative Bloq began back in 2012. The current website team consists of eight full-time members of staff: Editor Georgia Coggan, Deputy Editor Rosie Hilder, Ecommerce Editor Beren Neale, Senior News Editor Daniel Piper, Editor, Digital Art and 3D Ian Dean, Tech Reviews Editor Erlingur Einarsson, Ecommerce Writer Beth Nicholls and Staff Writer Natalie Fear, as well as a roster of freelancers from around the world. The ImagineFX magazine team also pitch in, ensuring that content from leading digital art publication ImagineFX is represented on Creative Bloq.
