How to debug web animations
Seven developers reveal the tools they use to dig into code and fix issues.
Sign up to Creative Bloq's daily newsletter, which brings you the latest news and inspiration from the worlds of art, design and technology.
You are now subscribed
Your newsletter sign-up was successful
Want to add more newsletters?
Flash may have fallen by the wayside, but animation on the web is bigger than ever, and it's at the forefront of providing a compelling user experience. But whether you're using JavaScript or CSS animation, at some point you'll have to roll up your sleeves and get debugging.
Here, some leading developers reveal the tools they use to iron out bugs.
1. Chrome's Inspect Element tools
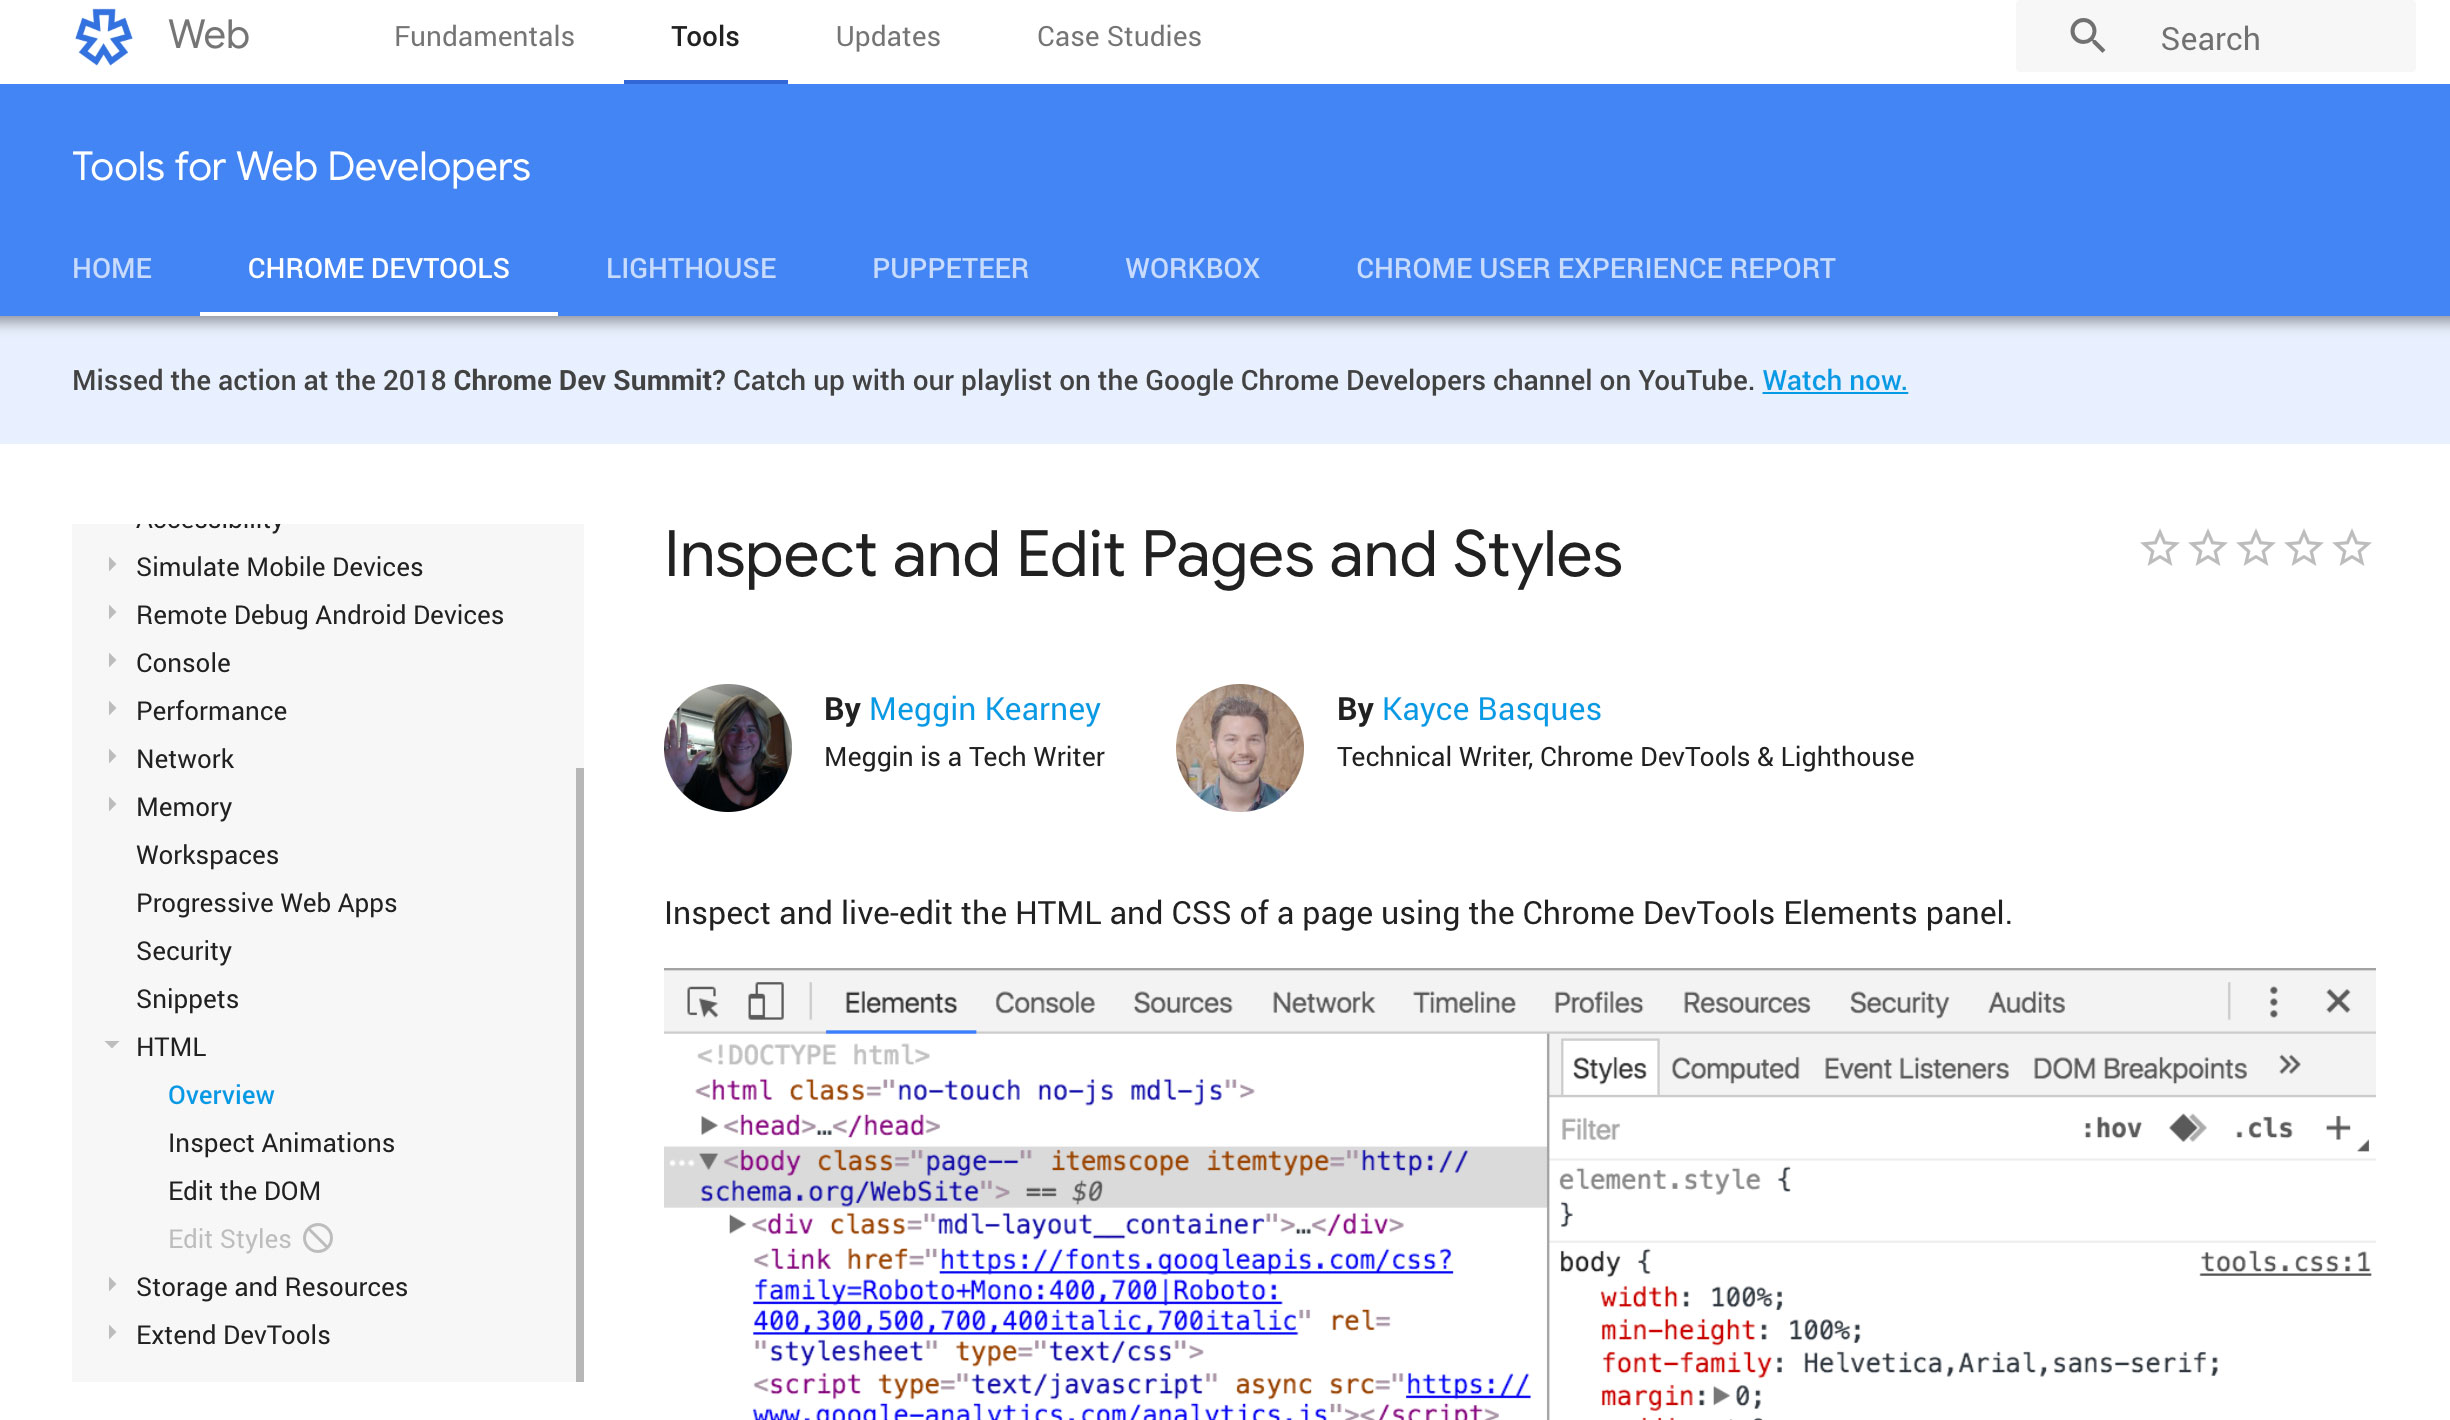
"Generally speaking I like to use the Chrome DevTools Inspect Element tools, which are getting better every day," says Steven Fabre, who works for InVision. "Instead of typing everything manually or doing the back-and-forth from cubic-bezier.com to your text editor, you can now change the animation's speed and easing with a slider and visual cubic-bezier graph editor.
Article continues below"Once I'm happy with the timing and easing of the animation, I like to enable paint flashing to identify and fix elements that may potentially make the animation jerky."
02. CodePen

Designer and developer Dudley Storey reduces the need for debugging from the start. "I avoid typos by writing CSS animations in Sass," he tells us, "using either CodePen or CodeKit – both of which flag syntax errors.
"If I am stuck with an unexpected result, I work backwards: one simple check is to set my CSS animation(s) to a single to { } declaration, which allows me to ensure the elements I'm animating can actually reach their final states."
03. Firefox Quantum: Developer Edition

"CSS animations and transitions can be tricky to debug," says web animations advocate and consultant, Rachel Nabors, "especially in UI animation, where the movement is often very quick. That's why I like Firefox Quantum Developer Edition's animation tools so much.
Sign up to Creative Bloq's daily newsletter, which brings you the latest news and inspiration from the worlds of art, design and technology.
"In the animation panel, I can scrub through an animation or even a group of animations to see what's actually happening. If an animation has already run, I don't need to refresh the page, just back that playhead up."
04. GreenSock

Senior UX engineer Sarah Drasner has a top tip for debugging JavaScript animations. "I usually use GreenSock," she tells us, "which comes equipped with timeScale(value). This handy function enables me to slow a whole timeline down so I can see how things are interacting.
"There's also timeline.seek(value), which enables me to find a specific place in time. The longer the animation, the more helpful this tool will be to your workflow."
05. Trial-and-error
"Animations play an important role in user interactions," notes Patrick Brosset, DevTools engineering manager at Mozilla. "Specially crafted animations not only look good but can help users make sense of changes in a user interface. Getting the perfect animation, fine-tuned to progress and last just the right way, is a trial and error process.
"Tooling is key. Debugging animations requires you to be able to see and edit CSS key frame rules right in the browser, and live edit complex cubic-bezier curves. But more importantly, being able to pause, seek, slow down or speed up an animation and edit its properties at any time is essential. Both Firefox and Chrome's developer tools enable you to do just this."
06. Chrome Canary
Web motion designer Val Head is another fan of Chrome and Firefox's developer animation tools. "These animation inspectors have saved me loads of time," she reveals. "I use these because they have the most features (though some are experimental). Both have visual timelines and cubic-bezier editors for individual animations.
"Canary's animation inspector is my current favourite. The editable timeline, playhead scrubber, and playback speed control let me get a really good look at what's happening in the code."
07. Your own library

Freelance interactive designer and creative coder Bryan James takes a more organic approach to ironing out animation errors. "I don't debug animations in any particular way," he says, "it's purely trial and error. Recently, I've started using my own small personal group of transition sets that I tend to stick to, so I'm getting quicker at spotting errors with just my eyes.
"My transition set is a group of variables declared as descriptive names, for when particular eases are necessary – akin to the standard set of ease-out, linear and so on, but a lot more bespoke and varied."
This article originally appeared in net magazine in 2015, and has since been updated; subscribe to net here.
Related articles:

Tanya is a writer covering art, design, and visual effects. She has 16 years of experience as a magazine journalist and has written for numerous publications including ImagineFX, 3D World, 3D Artist, Computer Arts, net magazine, and Creative Bloq. For Creative Bloq, she mostly writes about digital art and VFX.
