5 tools to make your website go faster
In the runup to his talk at our Generate event, Andi Smith outlines five handy tools for making your site as quick as it can be.
Sign up to Creative Bloq's daily newsletter, which brings you the latest news and inspiration from the worlds of art, design and technology.
You are now subscribed
Your newsletter sign-up was successful
Want to add more newsletters?
Ensuring your website performs optimally requires measuring several different factors. Here are five tools that can help you analyse your site's performance during the different stages of the life of your site.
- See Andi Smith talk about performance at Generate London 2015 – buy your ticket today!
01. Google PageSpeed
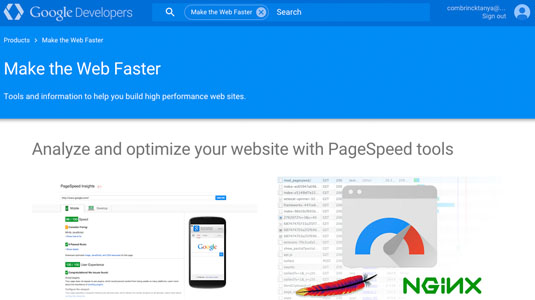
Google PageSpeed analyses your website and gives it a rating out of 100 for both mobile and desktop. For the areas on your website that it identifies as suboptimal it will provide suggestions on how you can improve them.
There's also a tool available for Grunt that allows you to test PageSpeed during build, and an example project showing how to test in Gulp.
Please be careful about where this is included in your workflow as it can increase build completion time considerably.
02. WebPageTest
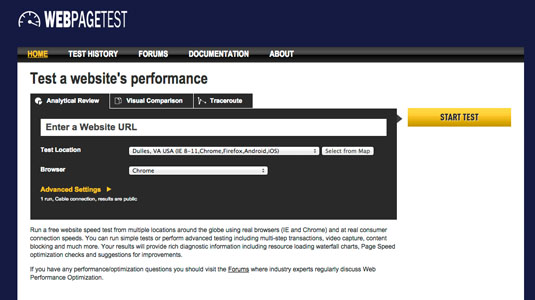
WebPageTest is a free online tool that evaluates the speed of your website using actual browsers from different locations around the globe at real connection speeds. The results provided show lots of useful performance diagnosis information, such as a video capture of the initial page load of your site; resource waterfall charts and suggestions for improvement.
With WebPageTest, the lower the SpeedIndex your site receives, the better. Chrome Developer Advocate Paul Irish recommends a speed index of under 1000.
03. Chrome Dev Tools Audits
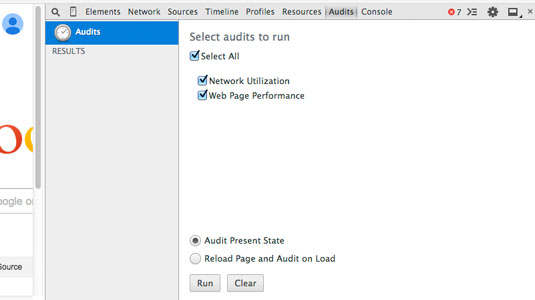
Chrome Developer Tools has a built-in auditing system for assessing web page performance. The audit will give you a breakdown of improvements to consider, such as unused CSS, coupled with the line numbers where you can find the offending items.
Sign up to Creative Bloq's daily newsletter, which brings you the latest news and inspiration from the worlds of art, design and technology.
To use it, first open the DevTools within Chrome and click the ‘Audit’ tab. In the audit panel, ensure both ’Network Utilization’ and ‘Web Page Performance’ are checked and hit ‘run’ to receive a breakdown. Expanding the items will reveal the files and, if applicable, the line numbers where performance can be optimised.
04. Chrome Dev Tools Timeline
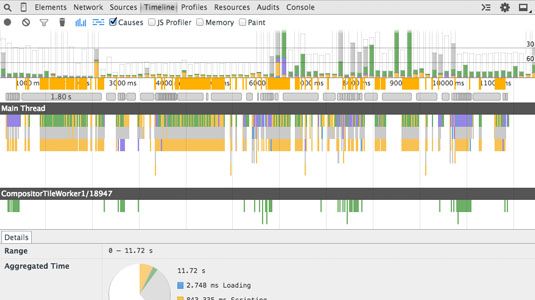
For performance issues that happen within your application such as a poorly performing animation or stuttering scroll you can use the ‘Timeline’ tab within Chrome Dev Tools.
The timeline panel can give you a break down of which events are taking the longest to complete; which frames are taking the longest to render, paint or run scripts; and you can see how memory usage within your application changes over time.
You can find out more information about the timeline panel in the Chrome Developer docs.
05. Google Analytics Performance Anomaly Detection
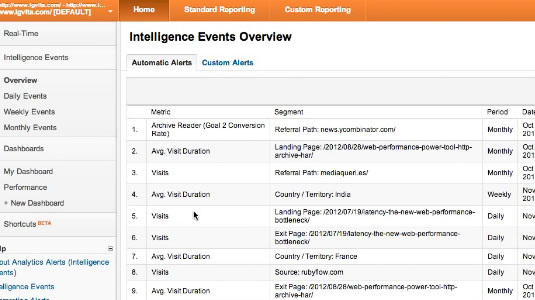
Once your website is out in the wild, it’s still important to keep a track of its performance. There could be a server issue, or a content author may include a particular large image on the homepage.
We can monitor our website’s page load times using Google Analytics’ Intelligence Events feature. By configuring these events we can detect poor performance and generate an alert when problems start to occur. You can find out more information about this technique on Ilya Grigorik’s blog.
Words: Andi Smith
At Generate London on 17-18 September 2015, Andi Smith will be speaking about how you can use Grunt and Gulp workflows to automate performance improvements to your websites.
Get your Generate ticket today!

The Creative Bloq team is made up of a group of art and design enthusiasts, and has changed and evolved since Creative Bloq began back in 2012. The current website team consists of eight full-time members of staff: Editor Georgia Coggan, Deputy Editor Rosie Hilder, Ecommerce Editor Beren Neale, Senior News Editor Daniel Piper, Editor, Digital Art and 3D Ian Dean, Tech Reviews Editor Erlingur Einarsson, Ecommerce Writer Beth Nicholls and Staff Writer Natalie Fear, as well as a roster of freelancers from around the world. The ImagineFX magazine team also pitch in, ensuring that content from leading digital art publication ImagineFX is represented on Creative Bloq.
