Create mobile-friendly interactive maps
Peter Cook shows how to build your own weather map using the open source Leaflet mapping library and data from the Met Office.

Leaflet is a lightweight JavaScript library for creating interactive maps on the web. It's an open source alternative to Google Maps, and because of its tiny size, it's great for mobile apps. Leaflet enables us to add markers and other geometric shapes to a map, making it great for geographic data visualisations.
In this tutorial we will create our very own weather map based on data from the Met Office. Along the way we'll learn how to make a map with Leaflet, how to download forecast data from the Met Office and how to add data-driven symbols to our map.
Making a map

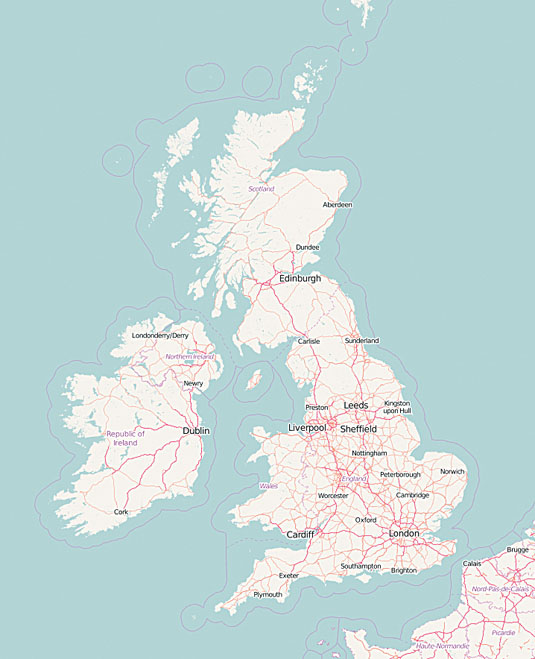
Leaflet creates 'tile-based' maps that are made up of multiple images (called 'tiles') downloaded from a server. There are a number of available tile servers, but to begin with we'll use OpenStreetMap's tile server.
Let's start by creating an 'index.html' file with a container element in it:
<div id="myMap"></div>It's important to set the height of this element, otherwise the map will be invisible! To make a map using Leaflet we need to do three things:
- Create a map object using L.Map(), passing in the id of the container element
- Create a tile layer (using our chosen tile server)
- Set the view latitude, longitude and zoom level
Here's the JavaScript we need to create a simple map centred on the UK (see code example 1 in the GitHub repo):
var map = new L.Map('myMap');

var osmLayer = new L.TileLayer('http://{s}.tile.openstreetmap.org/{z}/{x}/{y}.png', { attribution: 'Map data (C) <a href="http://openstreetmap.org">OpenStreetMap</a> contributors' });

map.addLayer(osmLayer);
map.setView([55, -5], 6);
Getting the data
We're now going to grab some data from the Met Office's DataPoint service, which provides a number of weather-related data feeds. One of its offerings is an API that provides weather forecast data across a number of UK locations. We'll use this to fetch data for our map.
Daily design news, reviews, how-tos and more, as picked by the editors.
To use DataPoint, you'll first need to visit www.metoffice.gov.uk/datapoint and create an account. You'll then be able to retrieve your personal API key (if you don't want to do this, the data is provided in code example 2).
Let's make a simple request for a forecast at a specific date. Go to the following URL using your browser:
http://datapoint.metoffice.gov.uk/public/data/val/wxfcs/all/json/all?res=daily&time=YYYY-MM-DD&key=YOUR-API-KEY-HEREYou'll need to enter the date as a YYYY-MM-DD string (e.g. 2016-02-10) and paste your API key where it says YOUR-API-KEY-HERE. DataPoint only provides forecasts for around five days ahead, so you'll need to enter a date in the near future.
When you enter this URL, a big JSON object will eventually appear, looking something like this:
{"SiteRep":{"Wx":{"Param":[{"name":"FDm","units":"C","$":"Feels Like...From within your browser, save this to your project directory as forecast.json.
Loading the data
We can load forecast.json using jQuery's getJSON function. When I load in an unfamiliar data set, I'll often inspect it in Chrome's developer console (code example 2):
$.getJSON('forecast.json', function(data) {
console.log(data);
});
If we expand the data a few times in the console, we can see Sitemap.DV.Location, which is an array of locations. Each of these has a latitude and longitude, a name and a further object Period that contains the actual forecast data.
In the next stage, we'll iterate through this array and display a marker for each location.
Displaying the data

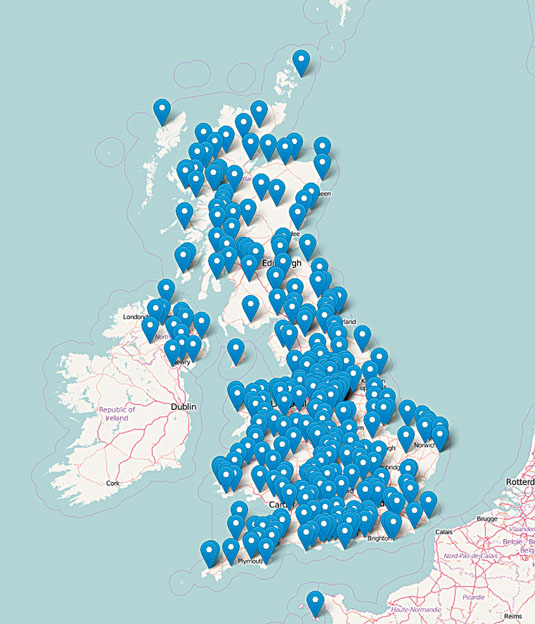
We'll now display the forecast locations on the map using markers (a marker is the simplest way of displaying a location on our map).
var sites = forecastData.SiteRep.DV.Location;
sites.forEach(function(site, i) {
if(i % 20 !== 0) return; // Just show a few sites
var marker = L.marker( [ +site.lat, +site.lon ] );
marker.addTo(map);
});
Here we've defined a function that takes our forecast data and loops through the SiteRep.DV.Location array we saw earlier.
For each site we create a marker using L.marker, passing in the latitude and longitude and then we add it to the map (code example 3). We only display a subset of the sites, as Leaflet struggles to display all 5,974 locations!
Top tip: In the dataset, the latitude and longitude values are strings, so we convert them to numbers by prepending with a + symbol.
Adding annotations
Leaflet makes it very easy to add an annotation to each marker using its bindPopup function:
marker.bindPopup( 'Chance of rain ' + site.Period.Rep[0].PPd + '%' );Here we're defining the text that should appear when a marker is clicked. In this case we're displaying Period.Rep[0].PPd, which is the chance of rain (code example 4).
Take a look here for more details on DataPoint's data structures. Now when we click on a marker, we'll see how likely it is to rain in that location.
Adding weather symbols
Clicking on a marker to display the forecast is a bit cumbersome, so let's display a weather symbol at each location.
Fortunately our data contains a special code Period.Rep[0].W that summarises the weather in a particular location. For example, 1 means it's a sunny day while 20 means hail showers. The precise details are here.
We're going to use a great set of weather icons developed by Alessio Atzeni called Meteocons. Let's start by defining a lookup table that determines the icon to display for each weather type:
var weatherTypeToIcon = {
0: 3,
1: 2,
2: 9,
etc.
}
We can now construct a pathname iconPath to the appropriate Meteocon icon. Once we've done this, we use Leaflet's icon function to create an icon object from our icon image, and we add this to the marker (see code example 5):
var iconIndex = weatherTypeToIcon[ site.Period.Rep[0].W ];
var iconPath = 'meteocons-icons/SVG/' + iconIndex + '.svg';
var weatherIcon = L.icon({
iconUrl: iconPath,
iconSize: [30, 30]
});
var marker = L.marker( [ +site.lat, +site.lon ], { icon: weatherIcon } );
Now we have a weather map based on real forecast data from the Met Office!
Making it pretty
Finally we'll make a couple of changes to make the map more visually pleasing. We'll start off by using a more neutral tile layer so the symbols stand out a little better:
var CartoDB_Positron = L.tileLayer('http://{s}.basemaps.cartocdn.com/light_all/{z}/{x}/{y}.png');
map.addLayer(CartoDB_Positron);
For brevity I've omitted the attribution information, but please don't forget to include this if you make your map public.
The icons aren't spaced very nicely, so we can write some code to space them out more regularly (see code example 6).
The pseudocode for this is:
includedSites = []
for each site:
if this site is not close to one in includedSites:
add it to includedSites
So there we have it! We've used Leaflet to make a weather map of the UK using real forecast data from the Met Office. There's lots of other types of data you might want to visualise on a map, and you can use a similar pattern to the one I've shown here. Have fun, and keep mapping!
Words: Peter Cook
Peter Cook is a web developer specialising in data visualisation. This article was originally published in issue 276 of net magazine.
Liked this? Read these!
- The 38 best tools for data visualization
- Discover the best user testing software
- Stunning examples of geometric patterns
- Top examples of experimental design
- What do you need to do to become a creative director?

The Creative Bloq team is made up of a group of art and design enthusiasts, and has changed and evolved since Creative Bloq began back in 2012. The current website team consists of eight full-time members of staff: Editor Georgia Coggan, Deputy Editor Rosie Hilder, Ecommerce Editor Beren Neale, Senior News Editor Daniel Piper, Editor, Digital Art and 3D Ian Dean, Tech Reviews Editor Erlingur Einarsson, Ecommerce Writer Beth Nicholls and Staff Writer Natalie Fear, as well as a roster of freelancers from around the world. The ImagineFX magazine team also pitch in, ensuring that content from leading digital art publication ImagineFX is represented on Creative Bloq.
