Create interactive charts in Ionic 2
Here's the process for creating interactive charts in one of the most popular hybrid app frameworks

When you work in a small team, it tends to be difficult to write and maintain separate code for Android, iOS, and Windows. That’s where hybrid frameworks like Ionic come into the picture. They not only enable us to write a single piece of code that can be used on all three platforms, but mean we can do so using our existing tech stack.
In this tutorial we are going explore how to tackle a common task like data visualisation in Ionic 2, one of the most promising hybrid app frameworks out there. I will use the FusionCharts JavaScript chart library (fusioncharts.com), for this project as it offers a large library of over 90 charts, is compatible with every device and browser, and is very easy to work with.
Setting up Ionic 2
To develop apps with Ionic 2, you need Node.js version 4+ and npm running on your OS. You can download the Node.js package from nodejs.org/en/download and npm will be installed along with it. If you already have a different version of Node.js running and want to run version 4+ as well, you can do that through Node Version Manager.
Next you need to install Ionic 2 Beta using npm. To do this, run npm install -g ionic@beta in your terminal from a user account with root privileges (we are installing the module globally). To simulate the Ionic app we are creating in multiple platforms, we need one more Node module: Cordova. You can install this globally using npm install -g cordova.
We are now ready to create our first Ionic app. However, with this setup, we’ll only be able to see the application in a browser. To simulate the app for an iOS or Android device, we need to build that particular platform module to Cordova. In this tutorial we will be building the iOS module, so you need to run ionic platform add ios.
Finally, you need to install Xcode. You’ll find instructions for this here.
Creating an Ionic 2 App
In this tutorial, we’re going to create an Ionic 2 app named ‘Charts’. We’ll create a ‘charts’ folder in your current working directory and bootstrap the app with a sample application. The sample app will contain a basic page, as described here.
Daily design news, reviews, how-tos and more, as picked by the editors.
To create this app, run ionic start charts --v2 in the current working directory (charts is the name of the app and --v2 tells Ionic we want to create an Ionic 2 app). On execution of this command, a charts folder will be created in the current working directory. To test the app in the browser, navigate to the charts folder and run ionic serve. This will launch the app in your default browser.
Adding a new page
Now let’s add a page/component to the charts application that will create JavaScript charts. First, we will just add a simple HTML page with 'Hello World' in it.
In Ionic 2, pages can be added to the Ionic app using the @Page decorator (an Ionic module based on Angular 2 components), which has access to the complete Ionic functionality. A bare-minimum page requires a template HTML file (which contains the markup), and a JavaScript file (containing the logic needed). You can find more details about Ionic pages here.
To create the page we will add donut-chart.js and donut-chart.html files to the charts/app/pages donut-chart directory. In the HTML file, we can add the code for app navigation and a simple ‘Hello World’ heading:
<ion-navbar *navbar>
<button menuToggle>
  <ion-icon name="menu"></ion-icon>
</button>
<ion-title>Hello Ionic</ion-title>
</ion-navbar>

<ion-content>
  <h1>Hello World</div>
</ion-content>
In the JavaScript file, we reference the HTML file created as the template for this component. Since we are not doing anything fancy just yet, we can just add an empty constructor ChartsPage.
import {Page} from 'ionic-angular';

@Page({
  templateUrl: 'build/pages/pie-chart/pie-chart.html'
})

export class ChartsPage {
  constructor() {
  }
}
We’ve just created a standalone component; now we need to link this into the main app. To do this we need to reference the component we have created in the app.js file in the app folder, and use the component in the pages property of the app component constructor.
import {ChartsPage} from './pages/donut-chart/donut-chart'

constructor(app, platform, menu) {
    // default app constructor
    this.app = app;
    this.platform = platform;
    this.menu = menu;
    this.initializeApp();
    // set our app's pages - we are adding donut chart here
    this.pages = [
      { title: 'Welcome', component: HelloIonicPage },
      { title: 'Donut Chart', component: ChartsPage}
    ];

    // make HelloIonicPage the root (or first) page - default step
    this.rootPage = HelloIonicPage;
}
After making these changes, the Ionic app in the browser should auto-reload (or use ionic serve from the terminal again). Now a new link should be visible in the side menu of the app, and on clicking that you should see ‘Hello World’ written on the screen.
Creating a JavaScript chart
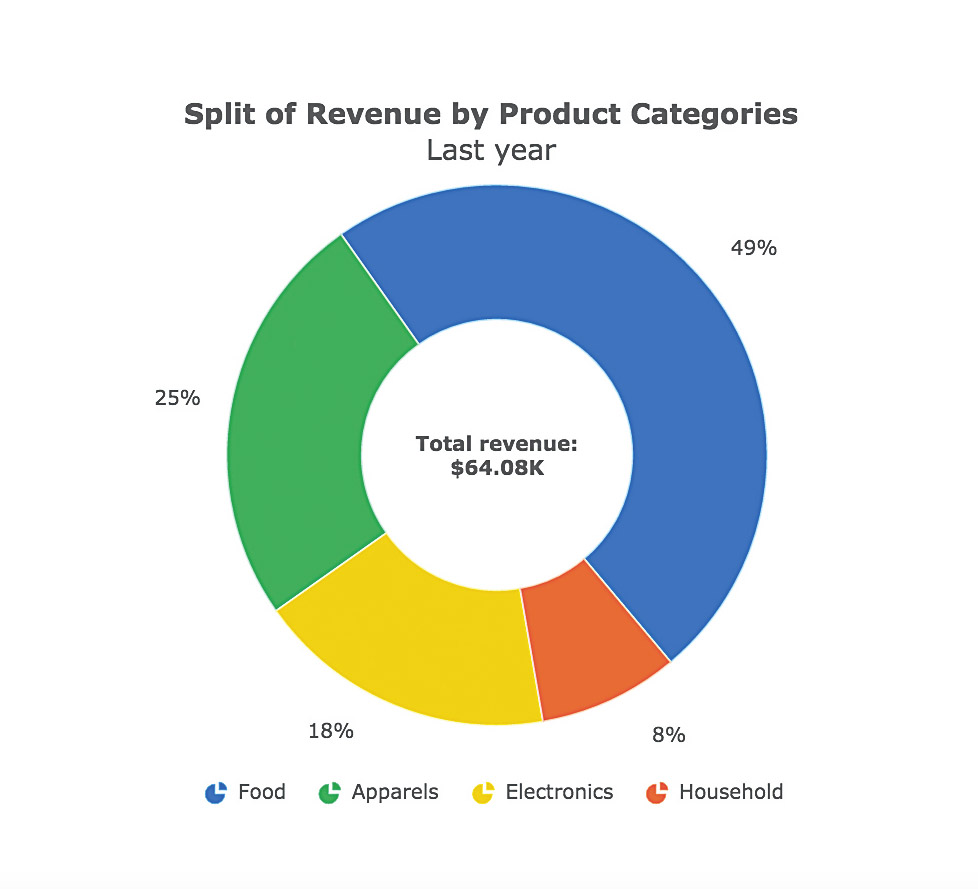
Now it’s time to modify our ‘Hello World’ page to create a doughnut chart. To be able to use the FusionCharts library, we need to first include the fusioncharts.js and fusioncharts.charts.js files in the www/index.html file.
Quick Tip: If both the files are in the same folder, then adding fusioncharts.js will be enough, as this will automatically include fusioncharts.charts.js.
<script type="text/javascript" src="path/to/fusioncharts.js"></script>We will now modify the HTML from the previous step to create a chart container:
<div id="chart-container"></div>In the constructor in donut-chart.js, which we created above, we need to add the following code to create the chart inside the chart container:
FusionCharts.ready(function() {
  var revenueChart = new FusionCharts({
    type: 'doughnut2d',
    renderAt: 'chart-container',
    width: '100%',
    height: '450',
    dataFormat: 'json',
    dataSource: {
      "chart": {
        "caption": "Split of Revenue by Product Categories",
        "subCaption": "Last year",
        "numberPrefix": "$",
        "paletteColors": "#0075c2,#1aaf5d,#f2c500,#f45b00,#8e0000",
        // more chart attributes
      },
      "data": [{
          "label": "Food",
          "value": "28504"
        } // more data
      ]
    }
  }).render();
});
In this code we are creating a new chart through the FusionCharts’ constructor. The properties used are briefly explained below:
type defines the type of chart
renderAt is the ID of the container where we want to render the chart
width and height are used to set the chart dimensions
dataFormat is the format in which we are going to feed the chart data (you can use JSON as well as XML)
dataSource contains chart cosmetics inside the FusionCharts chart object and the actual data to be plotted inside the data array
Although I have shown only four attributes in the chart object, there are more than a hundred others you can use to improve your chart’s design. You can read more about that here.
Once this code is added, run ionic serve to relaunch the app. You should see a ‘Donut Chart’ link in your side menu. If you followed all my steps properly, when you click that link you should see a doughnut chart! If not, please refer the code on the GitHub repo for this project to see where you went wrong.
Note: After checking it in the browser, use ionic emulate ios to load your app in the iOS simulator.
Summing up

As you’ve just seen, it is not difficult to get started with data visualisation in Ionic 2. Although I’ve just made a simple doughnut chart to demonstrate the process, it is possible to create complex charts with multiple datasets using the same process. The only thing you need to figure out is the format in which FusionCharts accepts the data for that particular chart type. Once you are able to do that, you will be able to make any chart from the library.
If you need any help with this topic or if you have any questions about the content of this tutorial, feel free to catch me on Twitter. I’m always happy to help!
This article originally appeared in net magazine issue 283; buy it here.

Thank you for reading 5 articles this month* Join now for unlimited access
Enjoy your first month for just £1 / $1 / €1
*Read 5 free articles per month without a subscription

Join now for unlimited access
Try first month for just £1 / $1 / €1
