Convert complex data into clear infographics
Eve Lloyd Knight at Human After All visualises dense stats for a major global report in six steps.
04. Sky pollution

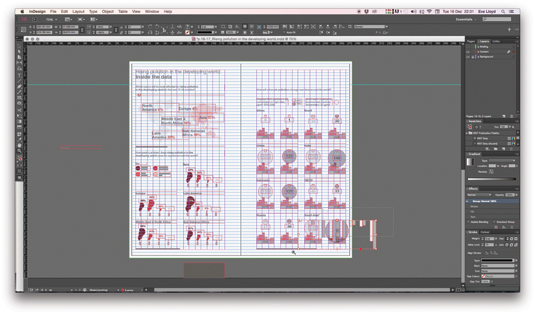
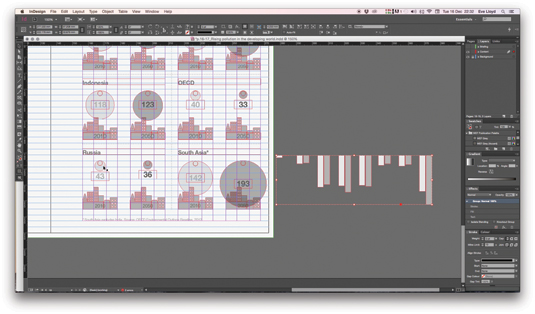
I pasted the columns into the InDesign spread and flipped them using the 'flip vertical' button on the top tool bar so the graphs read from the sky down, indicating how the pollution encroached on the cities. I then illustrated a small cityscape to indicate each 'urban area' and labelled them 2010 and 2050.
05. Quality guidelines

Using the column height I drew circles to represent the 'Projected PM10 (particles in air)' data. I drew a red dotted circle to indicate a quality guideline for maximum amount of acceptable pollution. I copied the column height and pasted it into the dialog box when drawing the circles to aid with sizing them.
06. Big city reveal

I changed the circles to the multiply mode so that they would reveal the cities beneath. I then added all of the labels and the key. By grouping the sets of data, I spaced everything accurately on the document grid, and lastly added the sources and small details.
Words: Eve Lloyd Knight
This article first appeared inside Computer Arts 236: the freelance issue – you'll find the digital edition inside the Computer Arts app, complete with a free 115-page supplement, The Freelance Handbook.
Like this? Try these...
- 9 steps for designing luxury packaging
- 9 tips for improving your time management
- The ultimate guide to logo design
Daily design news, reviews, how-tos and more, as picked by the editors.

The Creative Bloq team is made up of a group of art and design enthusiasts, and has changed and evolved since Creative Bloq began back in 2012. The current website team consists of eight full-time members of staff: Editor Georgia Coggan, Deputy Editor Rosie Hilder, Ecommerce Editor Beren Neale, Senior News Editor Daniel Piper, Editor, Digital Art and 3D Ian Dean, Tech Reviews Editor Erlingur Einarsson, Ecommerce Writer Beth Nicholls and Staff Writer Natalie Fear, as well as a roster of freelancers from around the world. The ImagineFX magazine team also pitch in, ensuring that content from leading digital art publication ImagineFX is represented on Creative Bloq.
